29
/
en
AIzaSyAYiBZKx7MnpbEhh9jyipgxe19OcubqV5w
April 1, 2024
216302
Pakistan
PAK
true
2
1
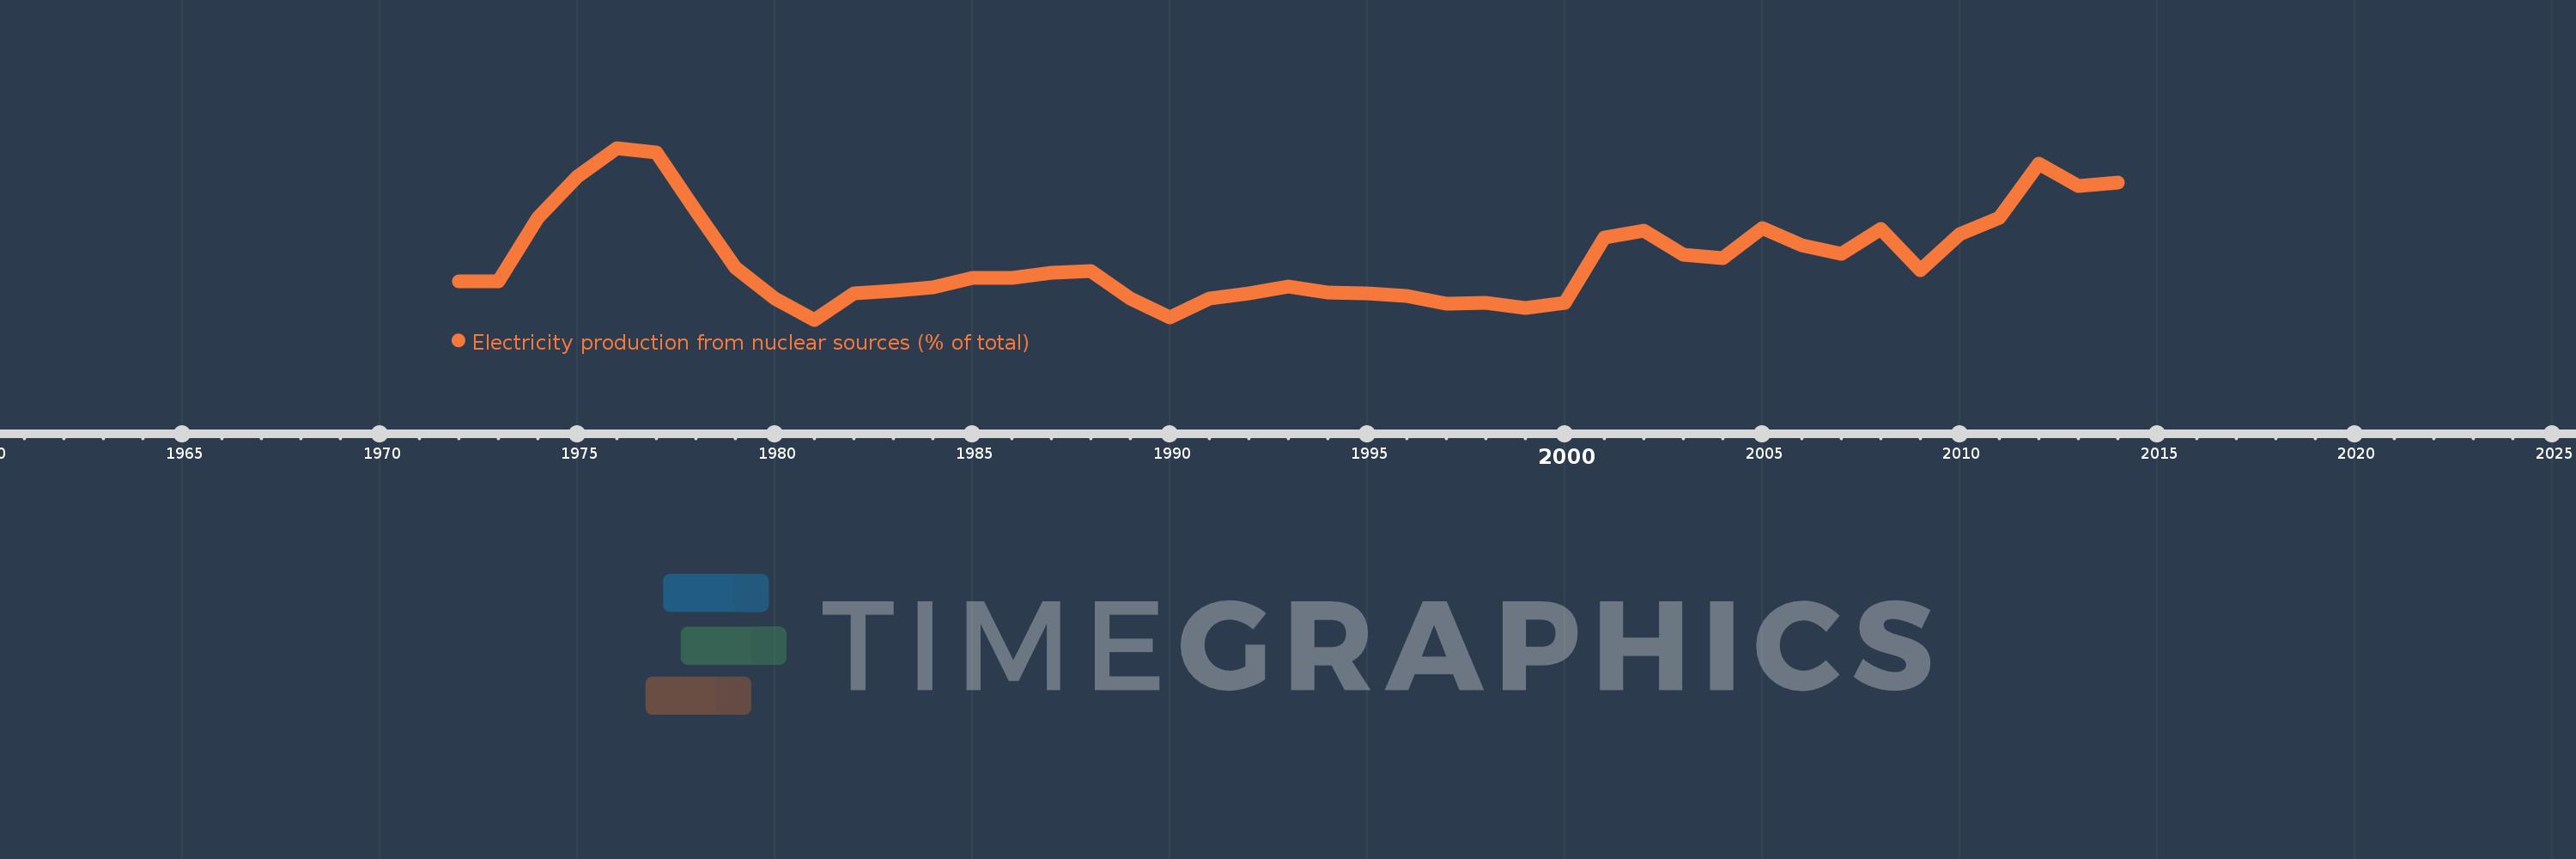
Electricity production from nuclear sources (% of total)
2014,2013,2012,2011,2010,2009,2008,2007,2006,2005,2004,2003,2002,2001,2000,1999,1998,1997,1996,1995,1994,1993,1992,1991,1990,1989,1988,1987,1986,1985,1984,1983,1982,1981,1980,1979,1978,1977,1976,1975,1974,1973,1972
This statistics in other country:
AlbaniaAlgeriaAngolaArab WorldArgentinaArmeniaAustraliaAustriaAzerbaijanBahrainBangladeshBelarusBelgiumBeninBoliviaBosnia and HerzegovinaBotswanaBrazilBrunei DarussalamBulgariaCambodiaCameroonCanadaCentral Europe and the BalticsChileChinaColombiaCongo, Dem. Rep.Congo, Rep.Costa RicaCote d'IvoireCroatiaCubaCuracaoCyprusCzech RepublicDenmarkDominican RepublicEarly-demographic dividendEast Asia & PacificEast Asia & Pacific (excluding high income)East Asia & Pacific (IDA & IBRD countries)EcuadorEgypt, Arab Rep.El SalvadorEritreaEstoniaEthiopiaEuro areaEurope & Central AsiaEurope & Central Asia (excluding high income)Europe & Central Asia (IDA & IBRD countries)European UnionFinlandFragile and conflict affected situationsFranceGabonGeorgiaGermanyGhanaGibraltarGreeceGuatemalaHaitiHeavily indebted poor countries (HIPC)High incomeHondurasHong Kong SAR, ChinaHungaryIBRD onlyIcelandIDA & IBRD totalIDA blendIDA onlyIDA totalIndiaIndonesiaIran, Islamic Rep.IraqIrelandIsraelItalyJamaicaJapanJordanKazakhstanKenyaKorea, Dem. People’s Rep.Korea, Rep.KosovoKuwaitKyrgyz RepublicLate-demographic dividendLatin America & Caribbean Latin America & Caribbean (excluding high income)Latin America & the Caribbean (IDA & IBRD countries)LatviaLeast developed countries: UN classificationLebanonLibyaLithuaniaLow & middle incomeLower middle incomeLuxembourgMacedonia, FYRMalaysiaMaltaMauritiusMexicoMiddle East & North AfricaMiddle East & North Africa (excluding high income)Middle East & North Africa (IDA & IBRD countries)Middle incomeMoldovaMongoliaMontenegroMoroccoMozambiqueMyanmarNamibiaNepalNetherlandsNew ZealandNicaraguaNigerNigeriaNorth AmericaNorwayOECD membersOmanOther small statesPakistanPanamaParaguayPeruPhilippinesPolandPortugalPost-demographic dividendPre-demographic dividendQatarRomaniaRussian FederationSaudi ArabiaSenegalSerbiaSingaporeSlovak RepublicSloveniaSmall statesSouth AfricaSouth AsiaSouth Asia (IDA & IBRD)South SudanSpainSri LankaSub-Saharan Africa Sub-Saharan Africa (excluding high income)Sub-Saharan Africa (IDA & IBRD countries)SudanSwedenSwitzerlandSyrian Arab RepublicTajikistanTanzaniaThailandTogoTrinidad and TobagoTunisiaTurkeyTurkmenistanUkraineUnited Arab EmiratesUnited KingdomUnited StatesUpper middle incomeUruguayUzbekistanVenezuela, RBVietnamWorldYemen, Rep.ZambiaZimbabwe Timeline:
This timeline shows a graph from 1972 to 2014 of Pakistan. No data until 1971. Number of actual observations by date: 43.
Source name:
World Development Indicators
Source organization:
IEA Statistics © OECD/IEA 2014 (http://www.iea.org/stats/index.asp), subject to https://www.iea.org/t&c/termsandconditions/
Categories, topics:
Energy & Mining, Climate Change, Infrastructure
Last updated:
apr 23, 2017
Indicators value changes by year
At the date of observation
Value
Absolute change
Change from previous value
jan 1, 1972
1.373
+1.373
0.0%
jan 1, 1973
1.373
0.0
0.0%
jan 1, 1974
3.629
+2.256
164.22%
jan 1, 1975
5.064
+1.435
39.54%
jan 1, 1976
6.086
+1.022
20.18%
jan 1, 1977
5.911
-0.175
-2.88%
jan 1, 1978
3.871
-2.04
-34.52%
jan 1, 1979
1.867
-2.004
-51.77%
jan 1, 1980
0.748
-1.119
-59.94%
jan 1, 1981
0.013
-0.734
-98.21%
jan 1, 1982
0.934
+0.921
6.89K%
jan 1, 1983
1.035
+0.101
10.78%
jan 1, 1984
1.158
+0.123
11.88%
jan 1, 1985
1.481
+0.324
27.97%
jan 1, 1986
1.504
+0.023
1.54%
jan 1, 1987
1.68
+0.176
11.72%
jan 1, 1988
1.749
+0.069
4.08%
jan 1, 1989
0.768
-0.981
-56.11%
jan 1, 1990
0.087
-0.681
-88.7%
jan 1, 1991
0.778
+0.691
797.03%
jan 1, 1992
0.937
+0.16
20.51%
jan 1, 1993
1.192
+0.255
27.22%
jan 1, 1994
0.981
-0.211
-17.7%
jan 1, 1995
0.954
-0.027
-2.77%
jan 1, 1996
0.848
-0.106
-11.13%
jan 1, 1997
0.585
-0.263
-30.99%
jan 1, 1998
0.603
+0.018
3.1%
jan 1, 1999
0.434
-0.169
-28.06%
jan 1, 2000
0.607
+0.173
39.74%
jan 1, 2001
2.932
+2.325
383.34%
jan 1, 2002
3.163
+0.231
7.89%
jan 1, 2003
2.298
-0.865
-27.34%
jan 1, 2004
2.177
-0.121
-5.27%
jan 1, 2005
3.264
+1.087
49.91%
jan 1, 2006
2.653
-0.611
-18.72%
jan 1, 2007
2.33
-0.323
-12.19%
jan 1, 2008
3.217
+0.887
38.07%
jan 1, 2009
1.766
-1.45
-45.09%
jan 1, 2010
3.035
+1.269
71.85%
jan 1, 2011
3.623
+0.589
19.39%
jan 1, 2012
5.537
+1.913
52.8%
jan 1, 2013
4.737
-0.8
-14.45%
jan 1, 2014
4.861
+0.125
2.63%
Ranking of countries by current statistics by years


Comments: