29
/
en
AIzaSyAYiBZKx7MnpbEhh9jyipgxe19OcubqV5w
April 1, 2024
29768
Euro area
EMU
false
2
1
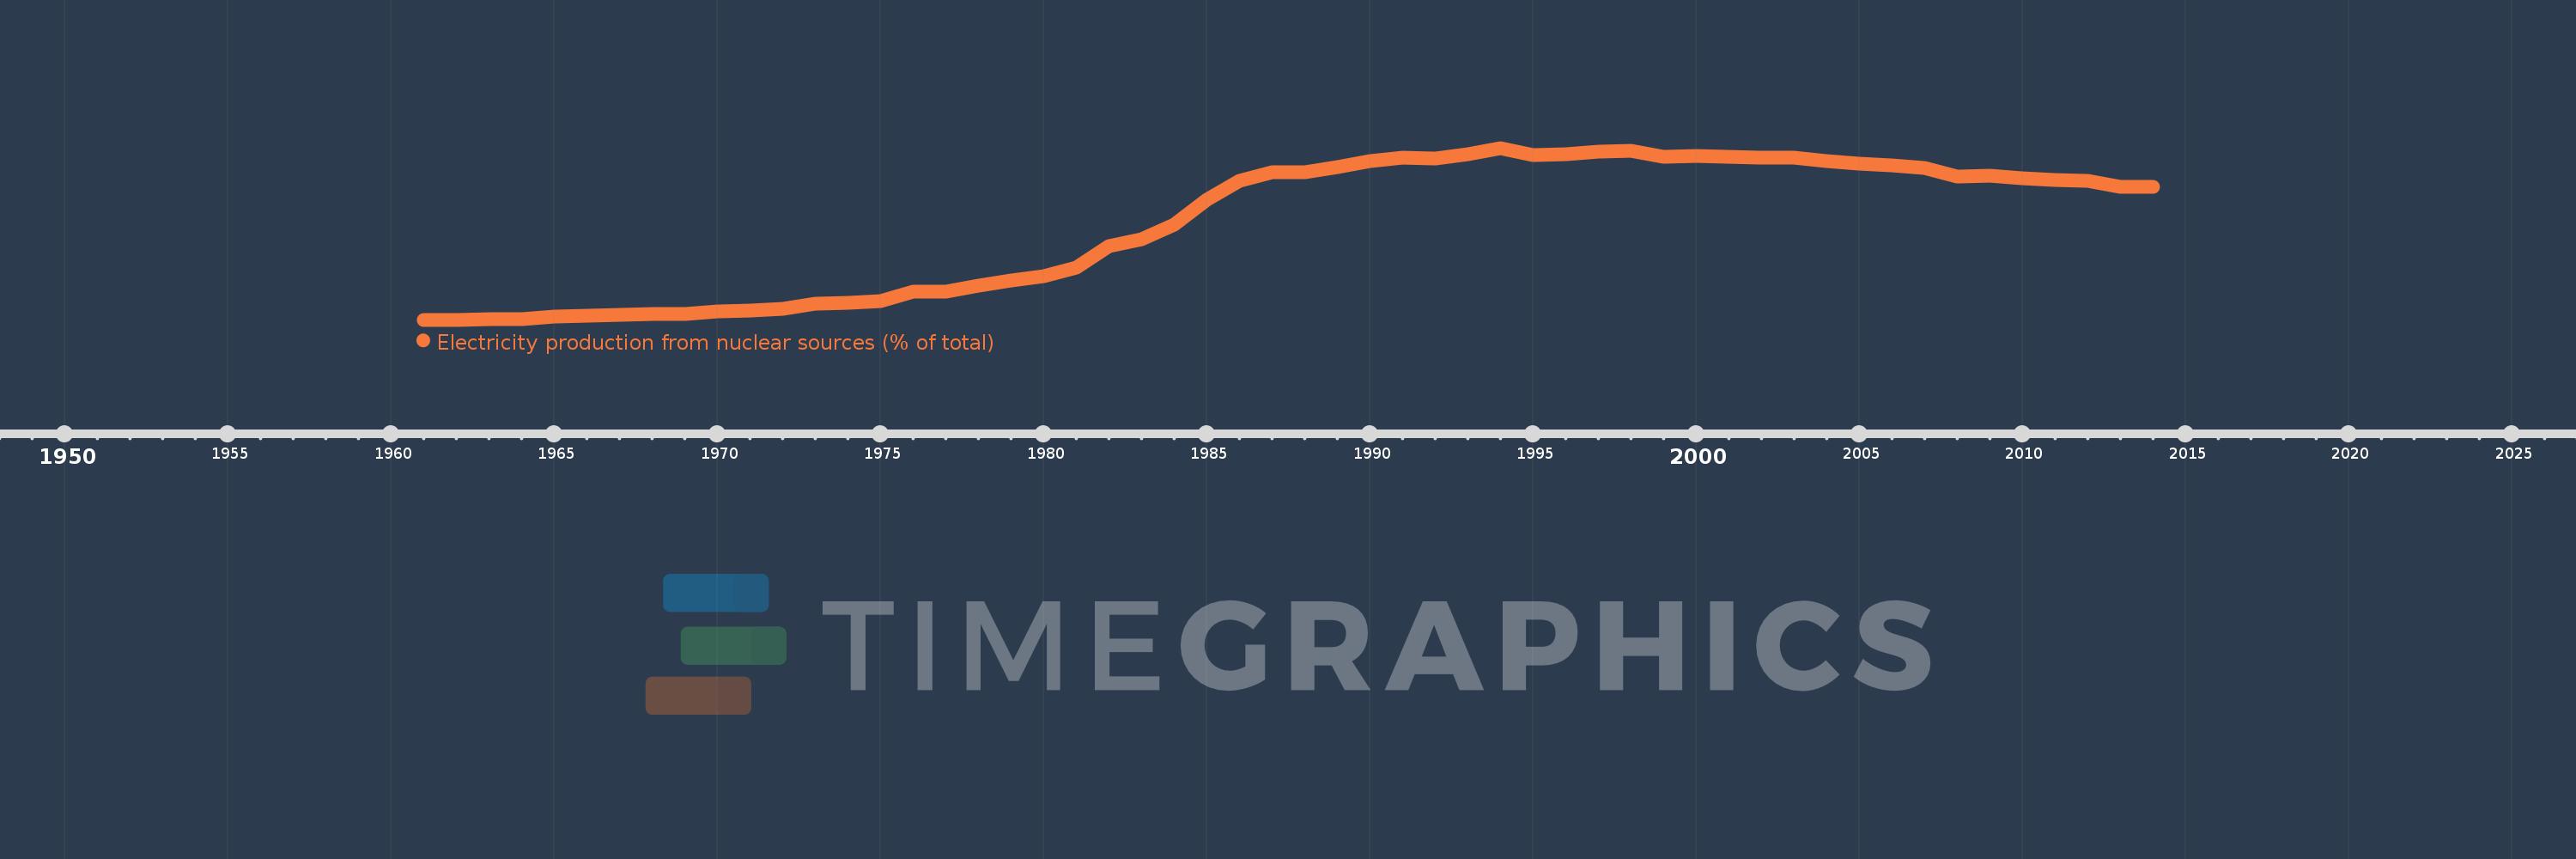
Electricity production from nuclear sources (% of total)
2014,2013,2012,2011,2010,2009,2008,2007,2006,2005,2004,2003,2002,2001,2000,1999,1998,1997,1996,1995,1994,1993,1992,1991,1990,1989,1988,1987,1986,1985,1984,1983,1982,1981,1980,1979,1978,1977,1976,1975,1974,1973,1972,1971,1970,1969,1968,1967,1966,1965,1964,1963,1962,1961
This statistics in other country:
AlbaniaAlgeriaAngolaArab WorldArgentinaArmeniaAustraliaAustriaAzerbaijanBahrainBangladeshBelarusBelgiumBeninBoliviaBosnia and HerzegovinaBotswanaBrazilBrunei DarussalamBulgariaCambodiaCameroonCanadaCentral Europe and the BalticsChileChinaColombiaCongo, Dem. Rep.Congo, Rep.Costa RicaCote d'IvoireCroatiaCubaCuracaoCyprusCzech RepublicDenmarkDominican RepublicEarly-demographic dividendEast Asia & PacificEast Asia & Pacific (excluding high income)East Asia & Pacific (IDA & IBRD countries)EcuadorEgypt, Arab Rep.El SalvadorEritreaEstoniaEthiopiaEuro areaEurope & Central AsiaEurope & Central Asia (excluding high income)Europe & Central Asia (IDA & IBRD countries)European UnionFinlandFragile and conflict affected situationsFranceGabonGeorgiaGermanyGhanaGibraltarGreeceGuatemalaHaitiHeavily indebted poor countries (HIPC)High incomeHondurasHong Kong SAR, ChinaHungaryIBRD onlyIcelandIDA & IBRD totalIDA blendIDA onlyIDA totalIndiaIndonesiaIran, Islamic Rep.IraqIrelandIsraelItalyJamaicaJapanJordanKazakhstanKenyaKorea, Dem. People’s Rep.Korea, Rep.KosovoKuwaitKyrgyz RepublicLate-demographic dividendLatin America & Caribbean Latin America & Caribbean (excluding high income)Latin America & the Caribbean (IDA & IBRD countries)LatviaLeast developed countries: UN classificationLebanonLibyaLithuaniaLow & middle incomeLower middle incomeLuxembourgMacedonia, FYRMalaysiaMaltaMauritiusMexicoMiddle East & North AfricaMiddle East & North Africa (excluding high income)Middle East & North Africa (IDA & IBRD countries)Middle incomeMoldovaMongoliaMontenegroMoroccoMozambiqueMyanmarNamibiaNepalNetherlandsNew ZealandNicaraguaNigerNigeriaNorth AmericaNorwayOECD membersOmanOther small statesPakistanPanamaParaguayPeruPhilippinesPolandPortugalPost-demographic dividendPre-demographic dividendQatarRomaniaRussian FederationSaudi ArabiaSenegalSerbiaSingaporeSlovak RepublicSloveniaSmall statesSouth AfricaSouth AsiaSouth Asia (IDA & IBRD)South SudanSpainSri LankaSub-Saharan Africa Sub-Saharan Africa (excluding high income)Sub-Saharan Africa (IDA & IBRD countries)SudanSwedenSwitzerlandSyrian Arab RepublicTajikistanTanzaniaThailandTogoTrinidad and TobagoTunisiaTurkeyTurkmenistanUkraineUnited Arab EmiratesUnited KingdomUnited StatesUpper middle incomeUruguayUzbekistanVenezuela, RBVietnamWorldYemen, Rep.ZambiaZimbabwe Timeline:
This timeline shows a graph from 1961 to 2014 of Euro area. No data until 1960. Number of actual observations by date: 54.
Source name:
World Development Indicators
Source organization:
IEA Statistics © OECD/IEA 2014 (http://www.iea.org/stats/index.asp), subject to https://www.iea.org/t&c/termsandconditions/
Categories, topics:
Energy & Mining, Climate Change, Infrastructure
Last updated:
apr 23, 2017
Indicators value changes by year
Maximum:
37.704
jan 1, 1994
At the date of observation
Value
Absolute change
Change from previous value
jan 1, 1961
0.042
+0.042
0.0%
jan 1, 1962
0.078
+0.037
87.81%
jan 1, 1963
0.141
+0.063
80.2%
jan 1, 1964
0.202
+0.061
43.07%
jan 1, 1965
0.666
+0.464
230.01%
jan 1, 1966
0.909
+0.244
36.62%
jan 1, 1967
1.045
+0.136
14.91%
jan 1, 1968
1.275
+0.23
22.0%
jan 1, 1969
1.279
+0.004
0.3%
jan 1, 1970
1.837
+0.558
43.67%
jan 1, 1971
2.047
+0.21
11.45%
jan 1, 1972
2.518
+0.47
22.97%
jan 1, 1973
3.509
+0.992
39.4%
jan 1, 1974
3.754
+0.244
6.96%
jan 1, 1975
4.16
+0.407
10.83%
jan 1, 1976
6.148
+1.988
47.79%
jan 1, 1977
6.214
+0.065
1.07%
jan 1, 1978
7.468
+1.254
20.18%
jan 1, 1979
8.57
+1.102
14.76%
jan 1, 1980
9.595
+1.026
11.97%
jan 1, 1981
11.408
+1.813
18.89%
jan 1, 1982
16.263
+4.855
42.56%
jan 1, 1983
17.766
+1.503
9.24%
jan 1, 1984
20.899
+3.133
17.63%
jan 1, 1985
26.261
+5.362
25.66%
jan 1, 1986
30.518
+4.256
16.21%
jan 1, 1987
32.33
+1.813
5.94%
jan 1, 1988
32.418
+0.087
0.27%
jan 1, 1989
33.592
+1.175
3.62%
jan 1, 1990
34.736
+1.143
3.4%
jan 1, 1991
35.5
+0.764
2.2%
jan 1, 1992
35.477
-0.023
-0.07%
jan 1, 1993
36.345
+0.868
2.45%
jan 1, 1994
37.704
+1.36
3.74%
jan 1, 1995
36.12
-1.584
-4.2%
jan 1, 1996
36.418
+0.298
0.82%
jan 1, 1997
36.939
+0.521
1.43%
jan 1, 1998
37.065
+0.126
0.34%
jan 1, 1999
35.738
-1.327
-3.58%
jan 1, 2000
35.888
+0.15
0.42%
jan 1, 2001
35.857
-0.031
-0.09%
jan 1, 2002
35.589
-0.268
-0.75%
jan 1, 2003
35.665
+0.076
0.21%
jan 1, 2004
34.734
-0.931
-2.61%
jan 1, 2005
34.289
-0.445
-1.28%
jan 1, 2006
33.789
-0.501
-1.46%
jan 1, 2007
33.281
-0.507
-1.5%
jan 1, 2008
31.37
-1.911
-5.74%
jan 1, 2009
31.566
+0.196
0.63%
jan 1, 2010
31.068
-0.499
-1.58%
jan 1, 2011
30.671
-0.396
-1.28%
jan 1, 2012
30.54
-0.131
-0.43%
jan 1, 2013
29.211
-1.33
-4.35%
jan 1, 2014
29.158
-0.053
-0.18%
Ranking of countries by current statistics by years


Comments: