29
/
en
AIzaSyAYiBZKx7MnpbEhh9jyipgxe19OcubqV5w
April 1, 2024
66475
Algeria
DZA
true
2
1
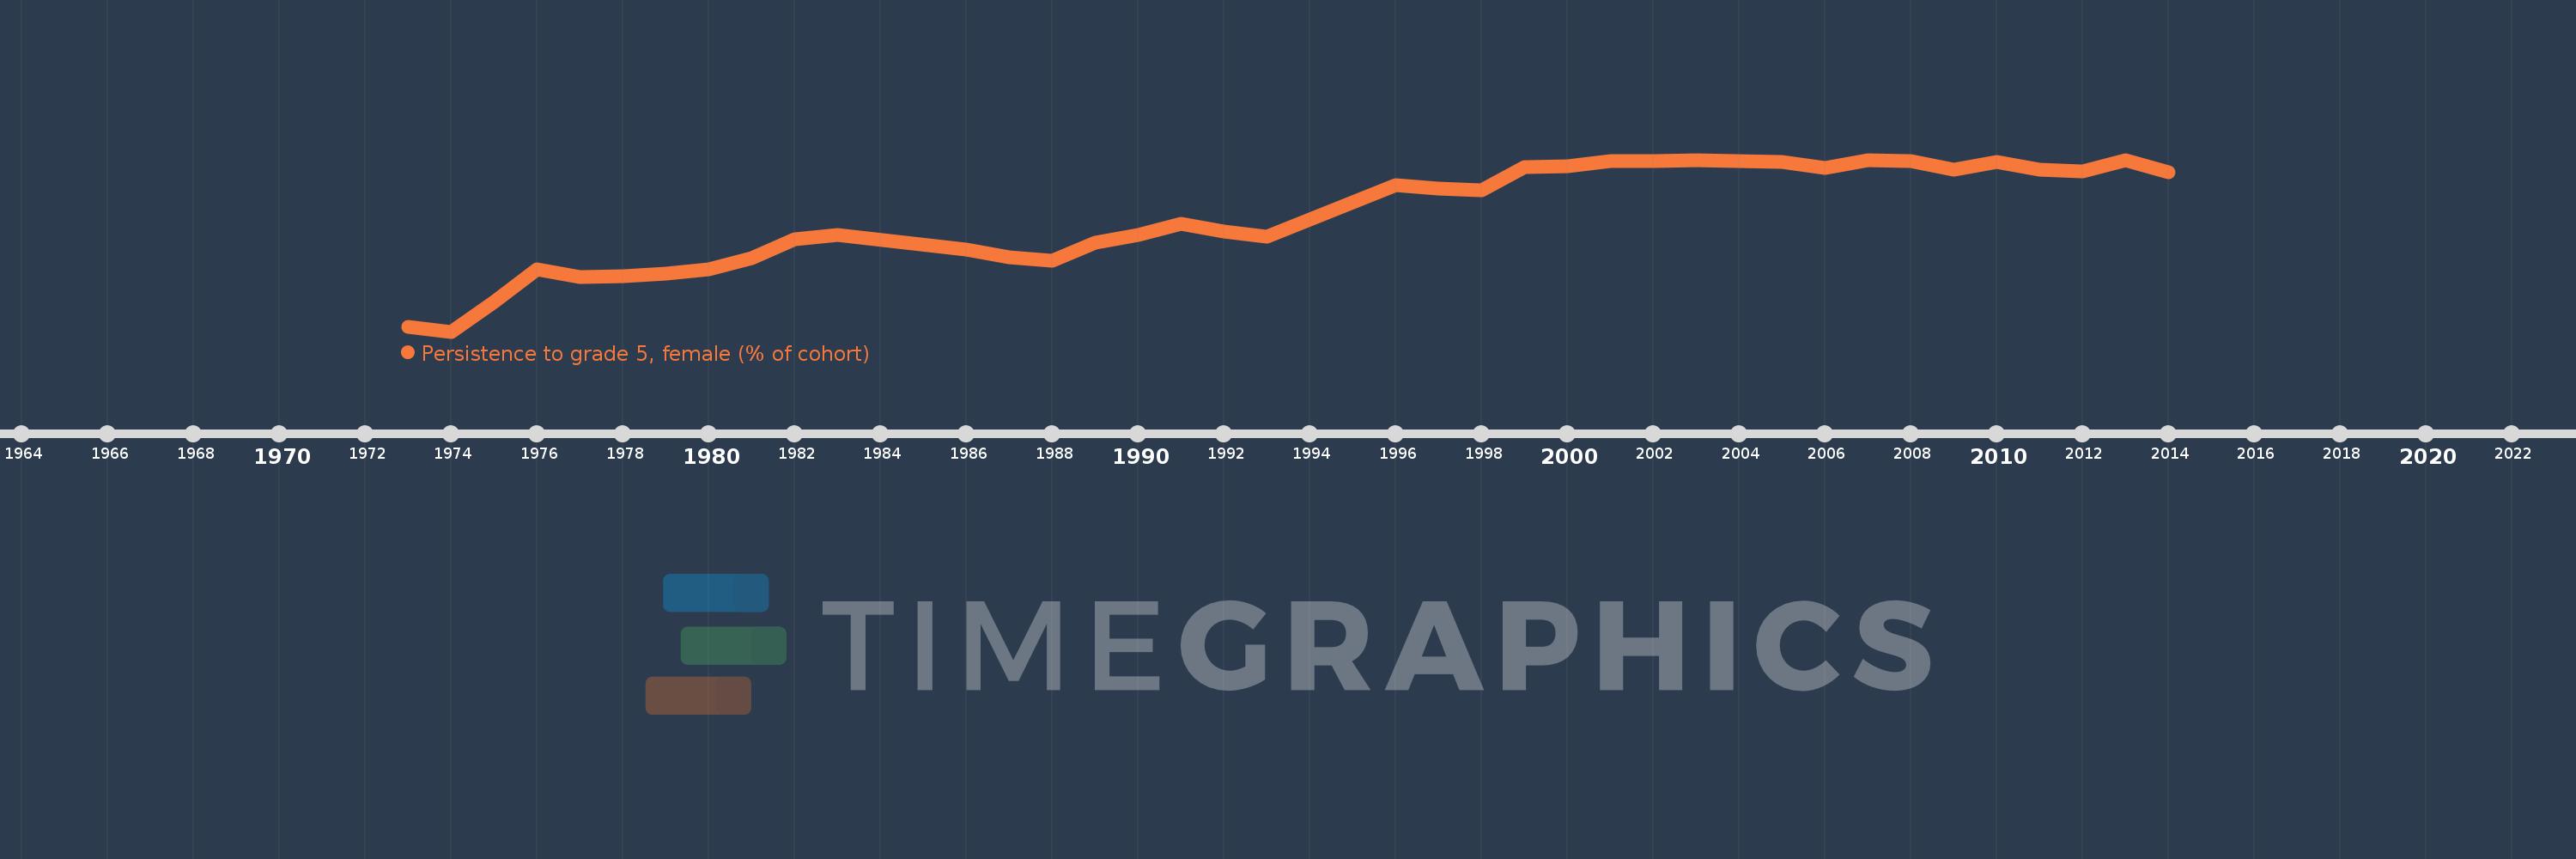
Persistence to grade 5, female (% of cohort)
2014,2013,2012,2011,2010,2009,2008,2007,2006,2005,2004,2003,2002,2001,2000,1999,1998,1997,1996,1993,1992,1991,1990,1989,1988,1987,1986,1983,1982,1981,1980,1979,1978,1977,1976,1975,1974,1973
This statistics in other country:
AfghanistanAlbaniaAlgeriaAndorraAngolaAntigua and BarbudaArab WorldArgentinaArubaBahamas, TheBahrainBangladeshBarbadosBelgiumBelizeBeninBermudaBhutanBoliviaBosnia and HerzegovinaBotswanaBrunei DarussalamBurkina FasoBurundiCabo VerdeCambodiaCameroonCanadaCaribbean small statesCayman IslandsCentral African RepublicChadChileChinaColombiaComorosCongo, Dem. Rep.Congo, Rep.Costa RicaCote d'IvoireCubaCyprusCzech RepublicDenmarkDjiboutiDominicaDominican RepublicEarly-demographic dividendEast Asia & PacificEast Asia & Pacific (excluding high income)East Asia & Pacific (IDA & IBRD countries)EcuadorEgypt, Arab Rep.El SalvadorEquatorial GuineaEritreaEstoniaEthiopiaFijiFinlandFranceGabonGambia, TheGeorgiaGhanaGreeceGrenadaGuatemalaGuineaGuinea-BissauGuyanaHaitiHeavily indebted poor countries (HIPC)HondurasHong Kong SAR, ChinaHungaryIcelandIDA blendIDA onlyIDA totalIndiaIndonesiaIran, Islamic Rep.IraqIrelandIsraelItalyJamaicaJapanJordanKenyaKiribatiKorea, Rep.KuwaitLao PDRLate-demographic dividendLatviaLeast developed countries: UN classificationLebanonLesothoLiberiaLibyaLiechtensteinLow incomeLower middle incomeLuxembourgMacao SAR, ChinaMadagascarMalawiMalaysiaMaldivesMaliMaltaMarshall IslandsMauritaniaMauritiusMexicoMiddle East & North AfricaMiddle East & North Africa (excluding high income)Middle East & North Africa (IDA & IBRD countries)MontenegroMoroccoMozambiqueMyanmarNamibiaNepalNetherlandsNicaraguaNigerNigeriaNorwayOmanOther small statesPacific island small statesPakistanPanamaPapua New GuineaParaguayPeruPhilippinesPolandPortugalPre-demographic dividendQatarRwandaSamoaSan MarinoSao Tome and PrincipeSaudi ArabiaSenegalSeychellesSierra LeoneSingaporeSloveniaSolomon IslandsSouth AfricaSouth AsiaSouth Asia (IDA & IBRD)SpainSri LankaSt. Kitts and NevisSt. LuciaSt. Vincent and the GrenadinesSub-Saharan Africa Sub-Saharan Africa (excluding high income)Sub-Saharan Africa (IDA & IBRD countries)SudanSurinameSwazilandSwedenSwitzerlandSyrian Arab RepublicTanzaniaThailandTimor-LesteTogoTongaTrinidad and TobagoTunisiaTurkeyUgandaUnited Arab EmiratesUpper middle incomeUruguayVanuatuVenezuela, RBVietnamYemen, Rep.ZambiaZimbabwe Timeline:
This timeline shows a graph from 1973 to 2014 of Algeria. No data until 1972. Number of actual observations by date: 38.
Source name:
World Development Indicators
Source organization:
United Nations Educational, Scientific, and Cultural Organization (UNESCO) Institute for Statistics.
Categories, topics:
Education, Gender
Last updated:
apr 23, 2017
Indicators value changes by year
Minimum:
53.044
jan 1, 1974
Maximum:
97.671
jan 1, 2013
At the date of observation
Value
Absolute change
Change from previous value
jan 1, 1973
54.218
+54.218
0.0%
jan 1, 1974
53.044
-1.173
-2.16%
jan 1, 1975
60.721
+7.677
14.47%
jan 1, 1976
69.21
+8.489
13.98%
jan 1, 1977
67.15
-2.06
-2.98%
jan 1, 1978
67.547
+0.397
0.59%
jan 1, 1979
68.101
+0.554
0.82%
jan 1, 1980
69.325
+1.224
1.8%
jan 1, 1981
72.05
+2.726
3.93%
jan 1, 1982
76.96
+4.909
6.81%
jan 1, 1983
78.096
+1.136
1.48%
jan 1, 1986
74.423
-3.673
-4.7%
jan 1, 1987
72.339
-2.083
-2.8%
jan 1, 1988
71.45
-0.889
-1.23%
jan 1, 1989
76.192
+4.742
6.64%
jan 1, 1990
78.04
+1.848
2.43%
jan 1, 1991
81.066
+3.027
3.88%
jan 1, 1992
78.982
-2.084
-2.57%
jan 1, 1993
77.689
-1.293
-1.64%
jan 1, 1996
91.081
+13.392
17.24%
jan 1, 1997
90.208
-0.873
-0.96%
jan 1, 1998
89.752
-0.456
-0.51%
jan 1, 1999
95.725
+5.973
6.65%
jan 1, 2000
96.107
+0.382
0.4%
jan 1, 2001
97.397
+1.29
1.34%
jan 1, 2002
97.262
-0.135
-0.14%
jan 1, 2003
97.475
+0.213
0.22%
jan 1, 2004
97.391
-0.084
-0.09%
jan 1, 2005
97.129
-0.262
-0.27%
jan 1, 2006
95.618
-1.511
-1.56%
jan 1, 2007
97.488
+1.87
1.96%
jan 1, 2008
97.27
-0.218
-0.22%
jan 1, 2009
95.082
-2.188
-2.25%
jan 1, 2010
97.104
+2.023
2.13%
jan 1, 2011
95.133
-1.972
-2.03%
jan 1, 2012
94.553
-0.58
-0.61%
jan 1, 2013
97.671
+3.118
3.3%
jan 1, 2014
94.495
-3.176
-3.25%
Ranking of countries by current statistics by years


Comments: