29
/
en
AIzaSyAYiBZKx7MnpbEhh9jyipgxe19OcubqV5w
April 1, 2024
202053
Morocco
MAR
true
2
1
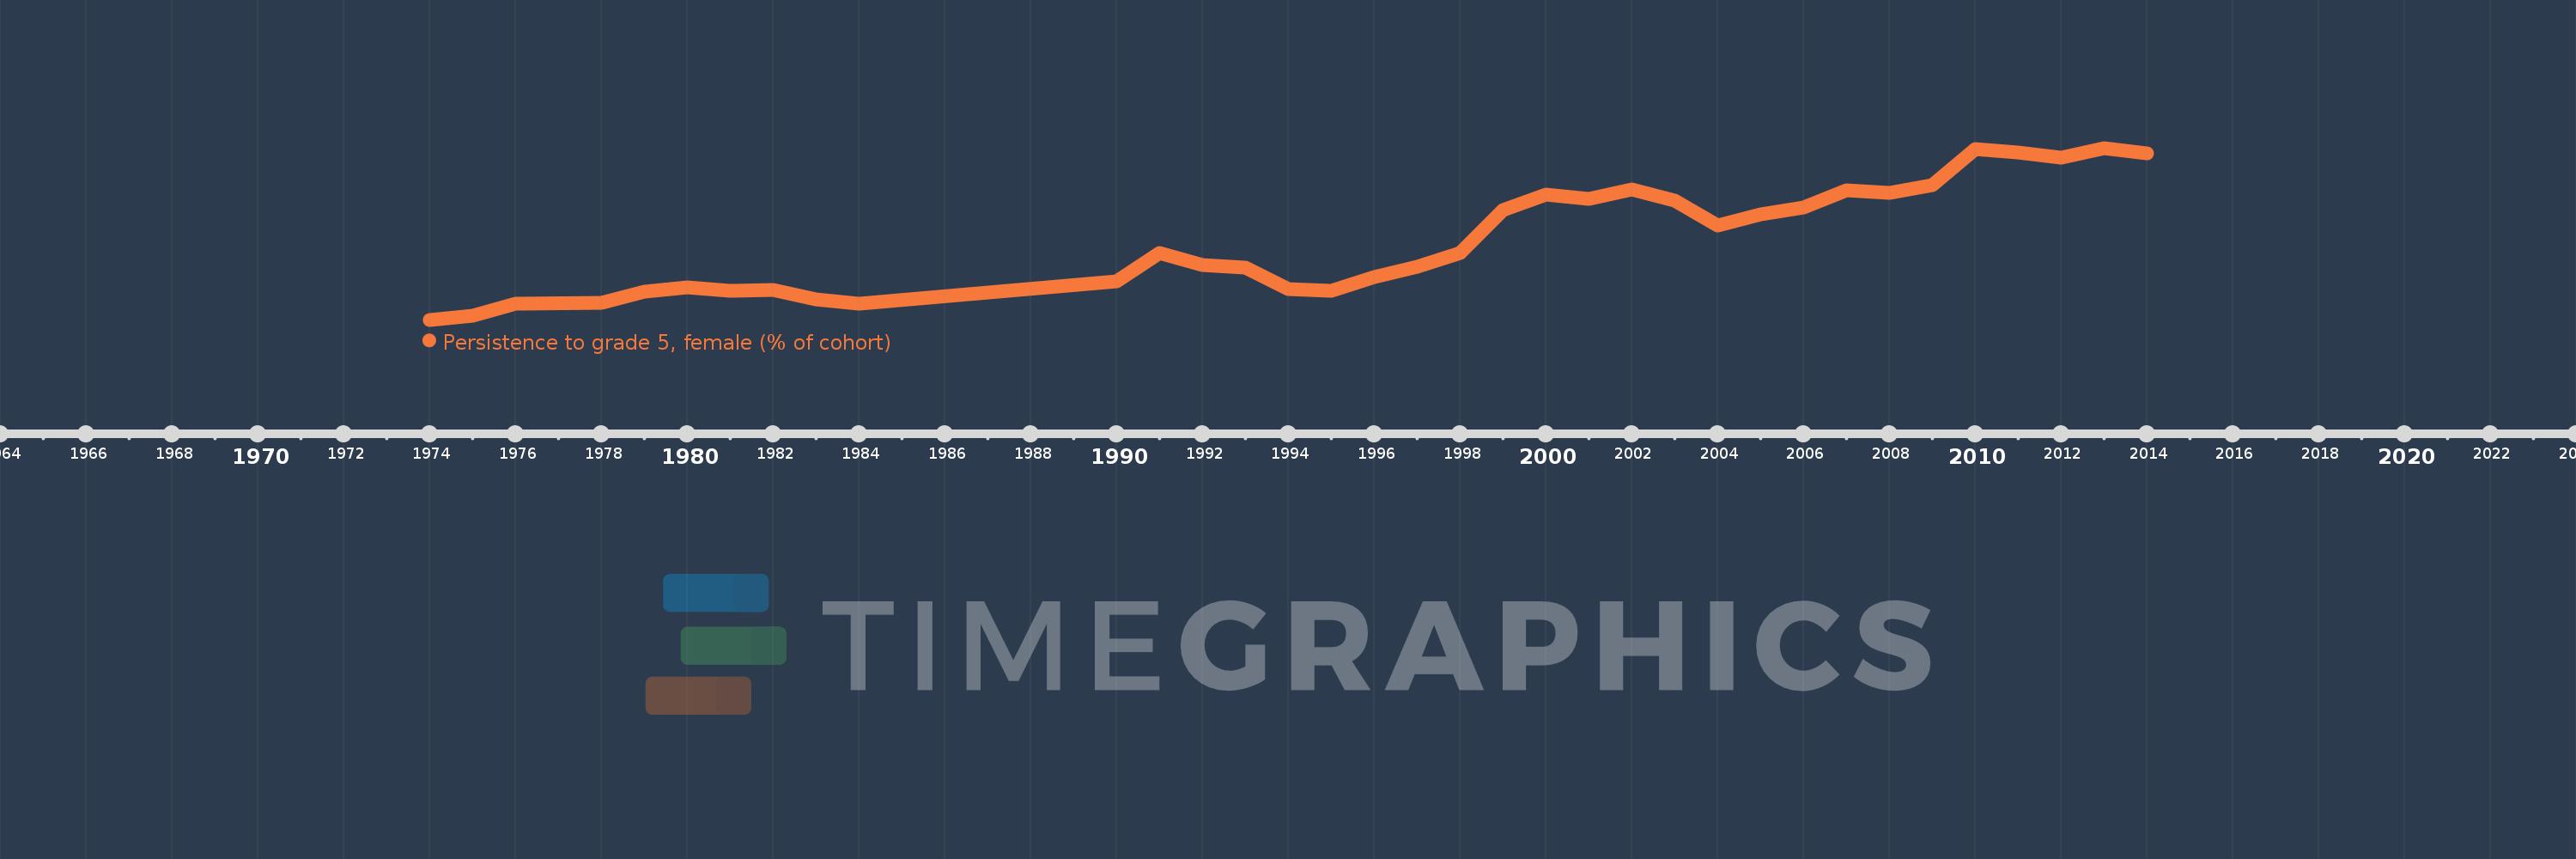
Persistence to grade 5, female (% of cohort)
2014,2013,2012,2011,2010,2009,2008,2007,2006,2005,2004,2003,2002,2001,2000,1999,1998,1997,1996,1995,1994,1993,1992,1991,1990,1984,1983,1982,1981,1980,1979,1978,1976,1975,1974
This statistics in other country:
AfghanistanAlbaniaAlgeriaAndorraAngolaAntigua and BarbudaArab WorldArgentinaArubaBahamas, TheBahrainBangladeshBarbadosBelgiumBelizeBeninBermudaBhutanBoliviaBosnia and HerzegovinaBotswanaBrunei DarussalamBurkina FasoBurundiCabo VerdeCambodiaCameroonCanadaCaribbean small statesCayman IslandsCentral African RepublicChadChileChinaColombiaComorosCongo, Dem. Rep.Congo, Rep.Costa RicaCote d'IvoireCubaCyprusCzech RepublicDenmarkDjiboutiDominicaDominican RepublicEarly-demographic dividendEast Asia & PacificEast Asia & Pacific (excluding high income)East Asia & Pacific (IDA & IBRD countries)EcuadorEgypt, Arab Rep.El SalvadorEquatorial GuineaEritreaEstoniaEthiopiaFijiFinlandFranceGabonGambia, TheGeorgiaGhanaGreeceGrenadaGuatemalaGuineaGuinea-BissauGuyanaHaitiHeavily indebted poor countries (HIPC)HondurasHong Kong SAR, ChinaHungaryIcelandIDA blendIDA onlyIDA totalIndiaIndonesiaIran, Islamic Rep.IraqIrelandIsraelItalyJamaicaJapanJordanKenyaKiribatiKorea, Rep.KuwaitLao PDRLate-demographic dividendLatviaLeast developed countries: UN classificationLebanonLesothoLiberiaLibyaLiechtensteinLow incomeLower middle incomeLuxembourgMacao SAR, ChinaMadagascarMalawiMalaysiaMaldivesMaliMaltaMarshall IslandsMauritaniaMauritiusMexicoMiddle East & North AfricaMiddle East & North Africa (excluding high income)Middle East & North Africa (IDA & IBRD countries)MontenegroMoroccoMozambiqueMyanmarNamibiaNepalNetherlandsNicaraguaNigerNigeriaNorwayOmanOther small statesPacific island small statesPakistanPanamaPapua New GuineaParaguayPeruPhilippinesPolandPortugalPre-demographic dividendQatarRwandaSamoaSan MarinoSao Tome and PrincipeSaudi ArabiaSenegalSeychellesSierra LeoneSingaporeSloveniaSolomon IslandsSouth AfricaSouth AsiaSouth Asia (IDA & IBRD)SpainSri LankaSt. Kitts and NevisSt. LuciaSt. Vincent and the GrenadinesSub-Saharan Africa Sub-Saharan Africa (excluding high income)Sub-Saharan Africa (IDA & IBRD countries)SudanSurinameSwazilandSwedenSwitzerlandSyrian Arab RepublicTanzaniaThailandTimor-LesteTogoTongaTrinidad and TobagoTunisiaTurkeyUgandaUnited Arab EmiratesUpper middle incomeUruguayVanuatuVenezuela, RBVietnamYemen, Rep.ZambiaZimbabwe Timeline:
This timeline shows a graph from 1974 to 2014 of Morocco. No data until 1973. Number of actual observations by date: 35.
Source name:
World Development Indicators
Source organization:
United Nations Educational, Scientific, and Cultural Organization (UNESCO) Institute for Statistics.
Categories, topics:
Education, Gender
Last updated:
apr 23, 2017
Indicators value changes by year
Minimum:
49.891
jan 1, 1974
Maximum:
94.108
jan 1, 2013
At the date of observation
Value
Absolute change
Change from previous value
jan 1, 1974
49.891
+49.891
0.0%
jan 1, 1975
51.021
+1.13
2.27%
jan 1, 1976
53.921
+2.9
5.68%
jan 1, 1978
54.159
+0.238
0.44%
jan 1, 1979
57.013
+2.854
5.27%
jan 1, 1980
58.225
+1.212
2.13%
jan 1, 1981
57.25
-0.976
-1.68%
jan 1, 1982
57.623
+0.374
0.65%
jan 1, 1983
55.202
-2.421
-4.2%
jan 1, 1984
53.947
-1.255
-2.27%
jan 1, 1990
59.804
+5.857
10.86%
jan 1, 1991
66.972
+7.168
11.99%
jan 1, 1992
64.072
-2.9
-4.33%
jan 1, 1993
63.355
-0.717
-1.12%
jan 1, 1994
57.781
-5.574
-8.8%
jan 1, 1995
57.388
-0.393
-0.68%
jan 1, 1996
60.832
+3.444
6.0%
jan 1, 1997
63.544
+2.712
4.46%
jan 1, 1998
66.999
+3.455
5.44%
jan 1, 1999
78.059
+11.06
16.51%
jan 1, 2000
82.044
+3.985
5.1%
jan 1, 2001
80.99
-1.053
-1.28%
jan 1, 2002
83.398
+2.408
2.97%
jan 1, 2003
80.451
-2.947
-3.53%
jan 1, 2004
74.134
-6.317
-7.85%
jan 1, 2005
77.088
+2.954
3.98%
jan 1, 2006
78.827
+1.739
2.26%
jan 1, 2007
83.227
+4.4
5.58%
jan 1, 2008
82.468
-0.759
-0.91%
jan 1, 2009
84.539
+2.071
2.51%
jan 1, 2010
93.872
+9.333
11.04%
jan 1, 2011
92.954
-0.918
-0.98%
jan 1, 2012
91.515
-1.439
-1.55%
jan 1, 2013
94.108
+2.593
2.83%
jan 1, 2014
92.638
-1.47
-1.56%
Ranking of countries by current statistics by years


Comments: