29
/
en
AIzaSyAYiBZKx7MnpbEhh9jyipgxe19OcubqV5w
April 1, 2024
256710
Sweden
SWE
true
2
1
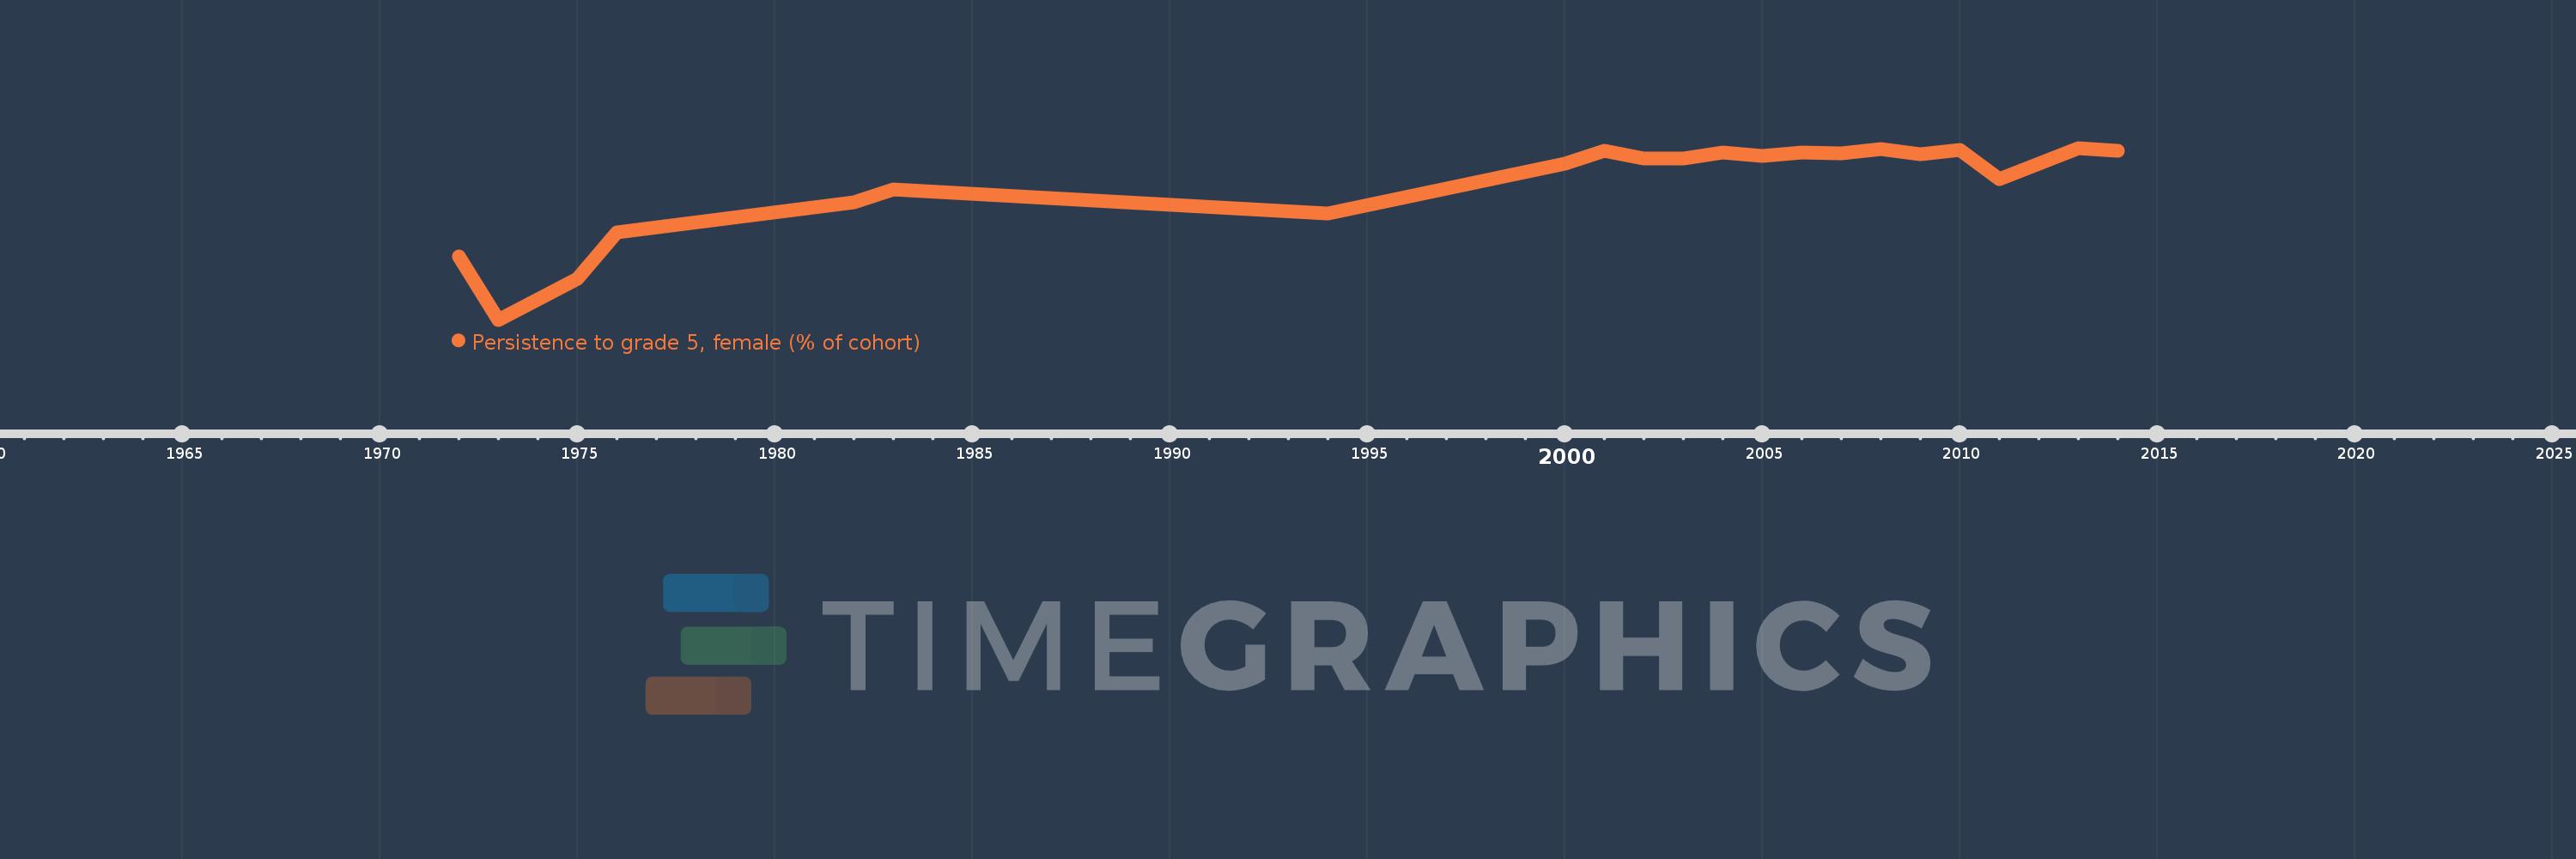
Persistence to grade 5, female (% of cohort)
2014,2013,2011,2010,2009,2008,2007,2006,2005,2004,2003,2002,2001,2000,1994,1983,1982,1976,1975,1974,1973,1972
This statistics in other country:
AfghanistanAlbaniaAlgeriaAndorraAngolaAntigua and BarbudaArab WorldArgentinaArubaBahamas, TheBahrainBangladeshBarbadosBelgiumBelizeBeninBermudaBhutanBoliviaBosnia and HerzegovinaBotswanaBrunei DarussalamBurkina FasoBurundiCabo VerdeCambodiaCameroonCanadaCaribbean small statesCayman IslandsCentral African RepublicChadChileChinaColombiaComorosCongo, Dem. Rep.Congo, Rep.Costa RicaCote d'IvoireCubaCyprusCzech RepublicDenmarkDjiboutiDominicaDominican RepublicEarly-demographic dividendEast Asia & PacificEast Asia & Pacific (excluding high income)East Asia & Pacific (IDA & IBRD countries)EcuadorEgypt, Arab Rep.El SalvadorEquatorial GuineaEritreaEstoniaEthiopiaFijiFinlandFranceGabonGambia, TheGeorgiaGhanaGreeceGrenadaGuatemalaGuineaGuinea-BissauGuyanaHaitiHeavily indebted poor countries (HIPC)HondurasHong Kong SAR, ChinaHungaryIcelandIDA blendIDA onlyIDA totalIndiaIndonesiaIran, Islamic Rep.IraqIrelandIsraelItalyJamaicaJapanJordanKenyaKiribatiKorea, Rep.KuwaitLao PDRLate-demographic dividendLatviaLeast developed countries: UN classificationLebanonLesothoLiberiaLibyaLiechtensteinLow incomeLower middle incomeLuxembourgMacao SAR, ChinaMadagascarMalawiMalaysiaMaldivesMaliMaltaMarshall IslandsMauritaniaMauritiusMexicoMiddle East & North AfricaMiddle East & North Africa (excluding high income)Middle East & North Africa (IDA & IBRD countries)MontenegroMoroccoMozambiqueMyanmarNamibiaNepalNetherlandsNicaraguaNigerNigeriaNorwayOmanOther small statesPacific island small statesPakistanPanamaPapua New GuineaParaguayPeruPhilippinesPolandPortugalPre-demographic dividendQatarRwandaSamoaSan MarinoSao Tome and PrincipeSaudi ArabiaSenegalSeychellesSierra LeoneSingaporeSloveniaSolomon IslandsSouth AfricaSouth AsiaSouth Asia (IDA & IBRD)SpainSri LankaSt. Kitts and NevisSt. LuciaSt. Vincent and the GrenadinesSub-Saharan Africa Sub-Saharan Africa (excluding high income)Sub-Saharan Africa (IDA & IBRD countries)SudanSurinameSwazilandSwedenSwitzerlandSyrian Arab RepublicTanzaniaThailandTimor-LesteTogoTongaTrinidad and TobagoTunisiaTurkeyUgandaUnited Arab EmiratesUpper middle incomeUruguayVanuatuVenezuela, RBVietnamYemen, Rep.ZambiaZimbabwe Timeline:
This timeline shows a graph from 1972 to 2014 of Sweden. No data until 1971. Number of actual observations by date: 22.
Source name:
World Development Indicators
Source organization:
United Nations Educational, Scientific, and Cultural Organization (UNESCO) Institute for Statistics.
Categories, topics:
Education, Gender
Last updated:
apr 23, 2017
Indicators value changes by year
Maximum:
99.965
jan 1, 2013
At the date of observation
Value
Absolute change
Change from previous value
jan 1, 1972
88.546
+88.546
0.0%
jan 1, 1973
81.89
-6.656
-7.52%
jan 1, 1974
83.994
+2.104
2.57%
jan 1, 1975
86.183
+2.189
2.61%
jan 1, 1976
91.121
+4.937
5.73%
jan 1, 1982
94.211
+3.091
3.39%
jan 1, 1983
95.583
+1.372
1.46%
jan 1, 1994
93.079
-2.504
-2.62%
jan 1, 2000
98.325
+5.246
5.64%
jan 1, 2001
99.705
+1.38
1.4%
jan 1, 2002
98.898
-0.807
-0.81%
jan 1, 2003
98.861
-0.037
-0.04%
jan 1, 2004
99.446
+0.585
0.59%
jan 1, 2005
99.08
-0.367
-0.37%
jan 1, 2006
99.453
+0.373
0.38%
jan 1, 2007
99.418
-0.035
-0.03%
jan 1, 2008
99.887
+0.469
0.47%
jan 1, 2009
99.281
-0.606
-0.61%
jan 1, 2010
99.789
+0.508
0.51%
jan 1, 2011
96.655
-3.134
-3.14%
jan 1, 2013
99.965
+3.31
3.42%
jan 1, 2014
99.705
-0.26
-0.26%
Ranking of countries by current statistics by years


Comments: