29
/
en
AIzaSyAYiBZKx7MnpbEhh9jyipgxe19OcubqV5w
April 1, 2024
261381
Tanzania
TZA
true
2
1
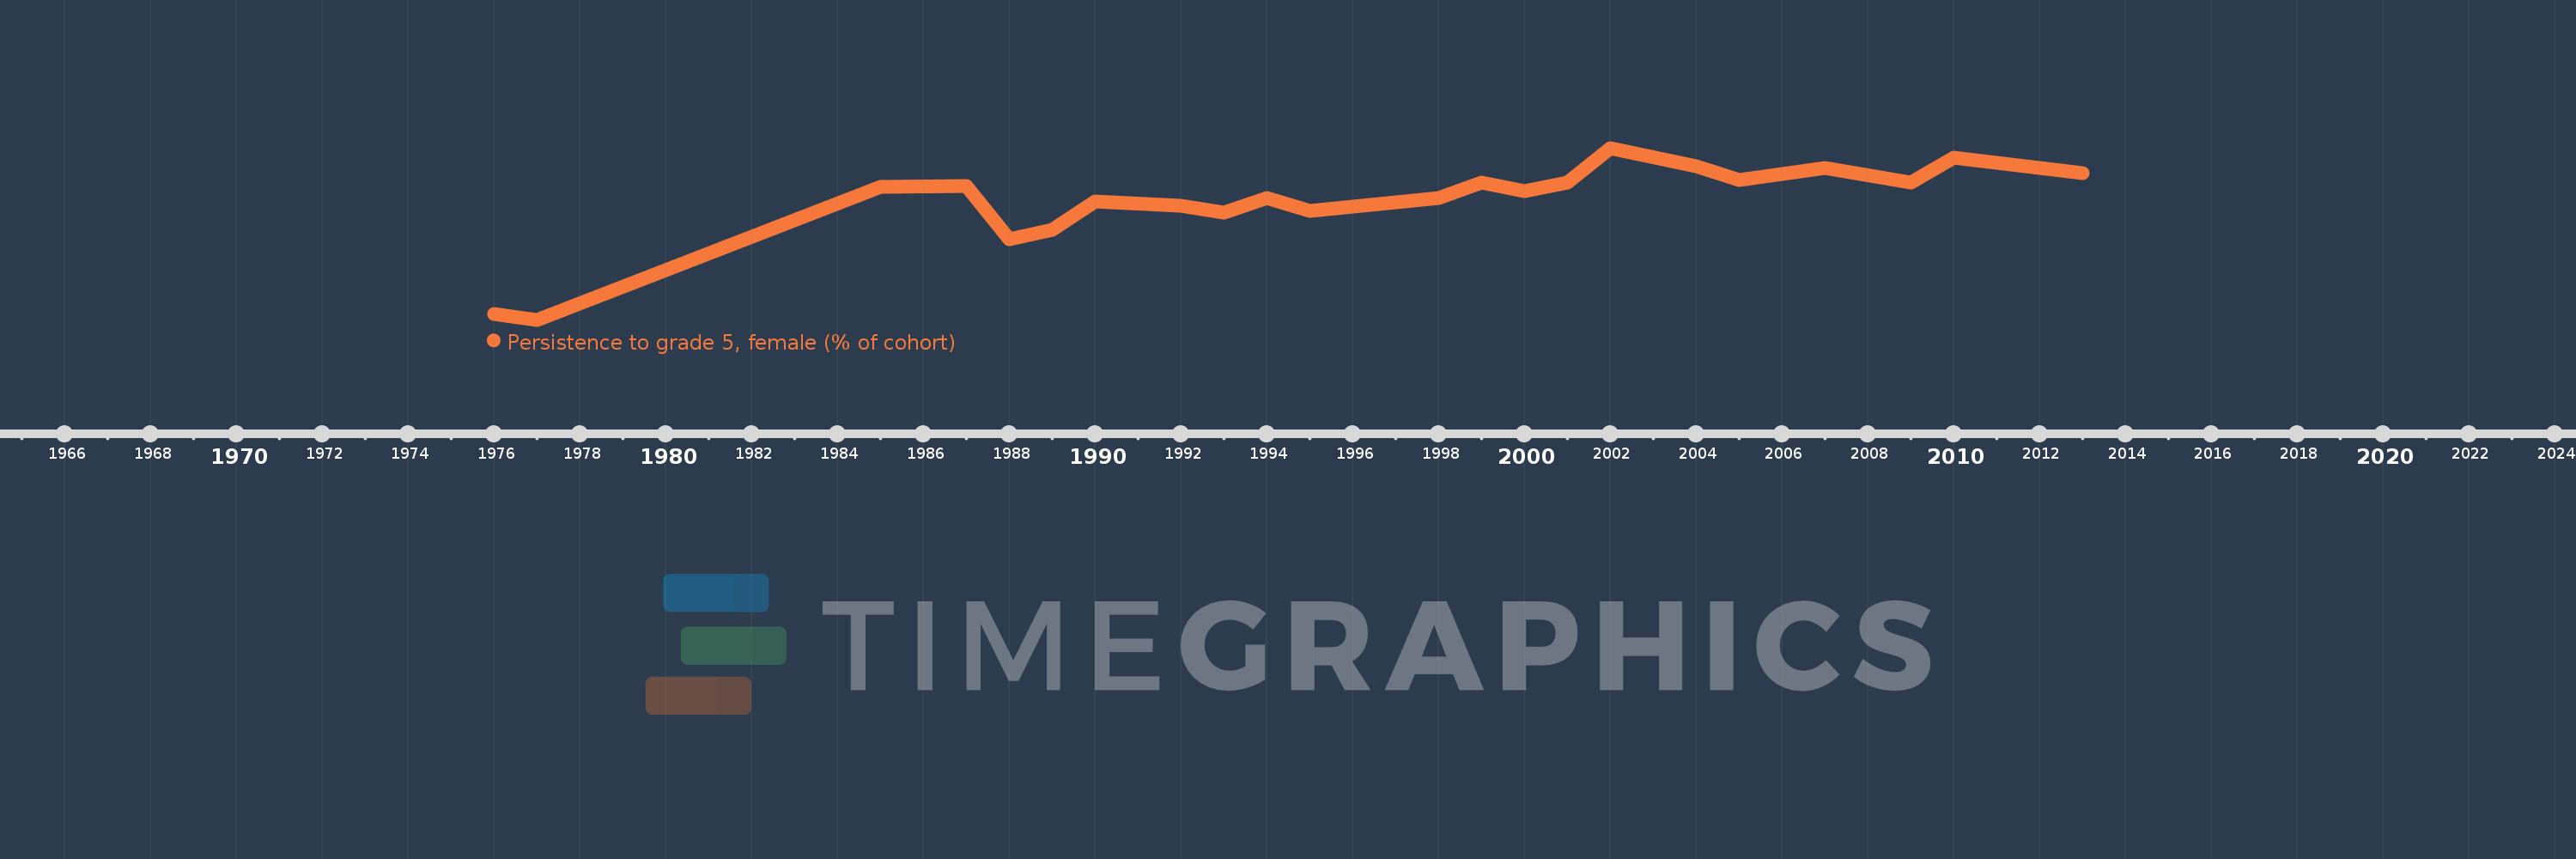
Persistence to grade 5, female (% of cohort)
2013,2010,2009,2007,2006,2005,2004,2002,2001,2000,1999,1998,1995,1994,1993,1992,1990,1989,1988,1987,1985,1977,1976
This statistics in other country:
AfghanistanAlbaniaAlgeriaAndorraAngolaAntigua and BarbudaArab WorldArgentinaArubaBahamas, TheBahrainBangladeshBarbadosBelgiumBelizeBeninBermudaBhutanBoliviaBosnia and HerzegovinaBotswanaBrunei DarussalamBurkina FasoBurundiCabo VerdeCambodiaCameroonCanadaCaribbean small statesCayman IslandsCentral African RepublicChadChileChinaColombiaComorosCongo, Dem. Rep.Congo, Rep.Costa RicaCote d'IvoireCubaCyprusCzech RepublicDenmarkDjiboutiDominicaDominican RepublicEarly-demographic dividendEast Asia & PacificEast Asia & Pacific (excluding high income)East Asia & Pacific (IDA & IBRD countries)EcuadorEgypt, Arab Rep.El SalvadorEquatorial GuineaEritreaEstoniaEthiopiaFijiFinlandFranceGabonGambia, TheGeorgiaGhanaGreeceGrenadaGuatemalaGuineaGuinea-BissauGuyanaHaitiHeavily indebted poor countries (HIPC)HondurasHong Kong SAR, ChinaHungaryIcelandIDA blendIDA onlyIDA totalIndiaIndonesiaIran, Islamic Rep.IraqIrelandIsraelItalyJamaicaJapanJordanKenyaKiribatiKorea, Rep.KuwaitLao PDRLate-demographic dividendLatviaLeast developed countries: UN classificationLebanonLesothoLiberiaLibyaLiechtensteinLow incomeLower middle incomeLuxembourgMacao SAR, ChinaMadagascarMalawiMalaysiaMaldivesMaliMaltaMarshall IslandsMauritaniaMauritiusMexicoMiddle East & North AfricaMiddle East & North Africa (excluding high income)Middle East & North Africa (IDA & IBRD countries)MontenegroMoroccoMozambiqueMyanmarNamibiaNepalNetherlandsNicaraguaNigerNigeriaNorwayOmanOther small statesPacific island small statesPakistanPanamaPapua New GuineaParaguayPeruPhilippinesPolandPortugalPre-demographic dividendQatarRwandaSamoaSan MarinoSao Tome and PrincipeSaudi ArabiaSenegalSeychellesSierra LeoneSingaporeSloveniaSolomon IslandsSouth AfricaSouth AsiaSouth Asia (IDA & IBRD)SpainSri LankaSt. Kitts and NevisSt. LuciaSt. Vincent and the GrenadinesSub-Saharan Africa Sub-Saharan Africa (excluding high income)Sub-Saharan Africa (IDA & IBRD countries)SudanSurinameSwazilandSwedenSwitzerlandSyrian Arab RepublicTanzaniaThailandTimor-LesteTogoTongaTrinidad and TobagoTunisiaTurkeyUgandaUnited Arab EmiratesUpper middle incomeUruguayVanuatuVenezuela, RBVietnamYemen, Rep.ZambiaZimbabwe Timeline:
This timeline shows a graph from 1976 to 2013 of Tanzania. No data until 1975. Number of actual observations by date: 23.
Source name:
World Development Indicators
Source organization:
United Nations Educational, Scientific, and Cultural Organization (UNESCO) Institute for Statistics.
Categories, topics:
Education, Gender
Last updated:
apr 23, 2017
Indicators value changes by year
Minimum:
29.496
jan 1, 1977
Maximum:
96.683
jan 1, 2002
At the date of observation
Value
Absolute change
Change from previous value
jan 1, 1976
31.847
+31.847
0.0%
jan 1, 1977
29.496
-2.351
-7.38%
jan 1, 1985
81.546
+52.051
176.47%
jan 1, 1987
81.676
+0.129
0.16%
jan 1, 1988
60.938
-20.737
-25.39%
jan 1, 1989
64.753
+3.815
6.26%
jan 1, 1990
75.617
+10.864
16.78%
jan 1, 1992
74.119
-1.498
-1.98%
jan 1, 1993
71.431
-2.688
-3.63%
jan 1, 1994
77.057
+5.626
7.88%
jan 1, 1995
72.039
-5.017
-6.51%
jan 1, 1998
77.147
+5.107
7.09%
jan 1, 1999
83.194
+6.047
7.84%
jan 1, 2000
79.652
-3.542
-4.26%
jan 1, 2001
83.258
+3.607
4.53%
jan 1, 2002
96.683
+13.425
16.12%
jan 1, 2004
89.603
-7.08
-7.32%
jan 1, 2005
84.251
-5.352
-5.97%
jan 1, 2006
86.477
+2.226
2.64%
jan 1, 2007
88.867
+2.39
2.76%
jan 1, 2009
83.033
-5.834
-6.56%
jan 1, 2010
92.724
+9.691
11.67%
jan 1, 2013
86.797
-5.926
-6.39%
Ranking of countries by current statistics by years


Comments: