29
/
en
AIzaSyAYiBZKx7MnpbEhh9jyipgxe19OcubqV5w
April 1, 2024
210855
Nicaragua
NIC
true
2
1
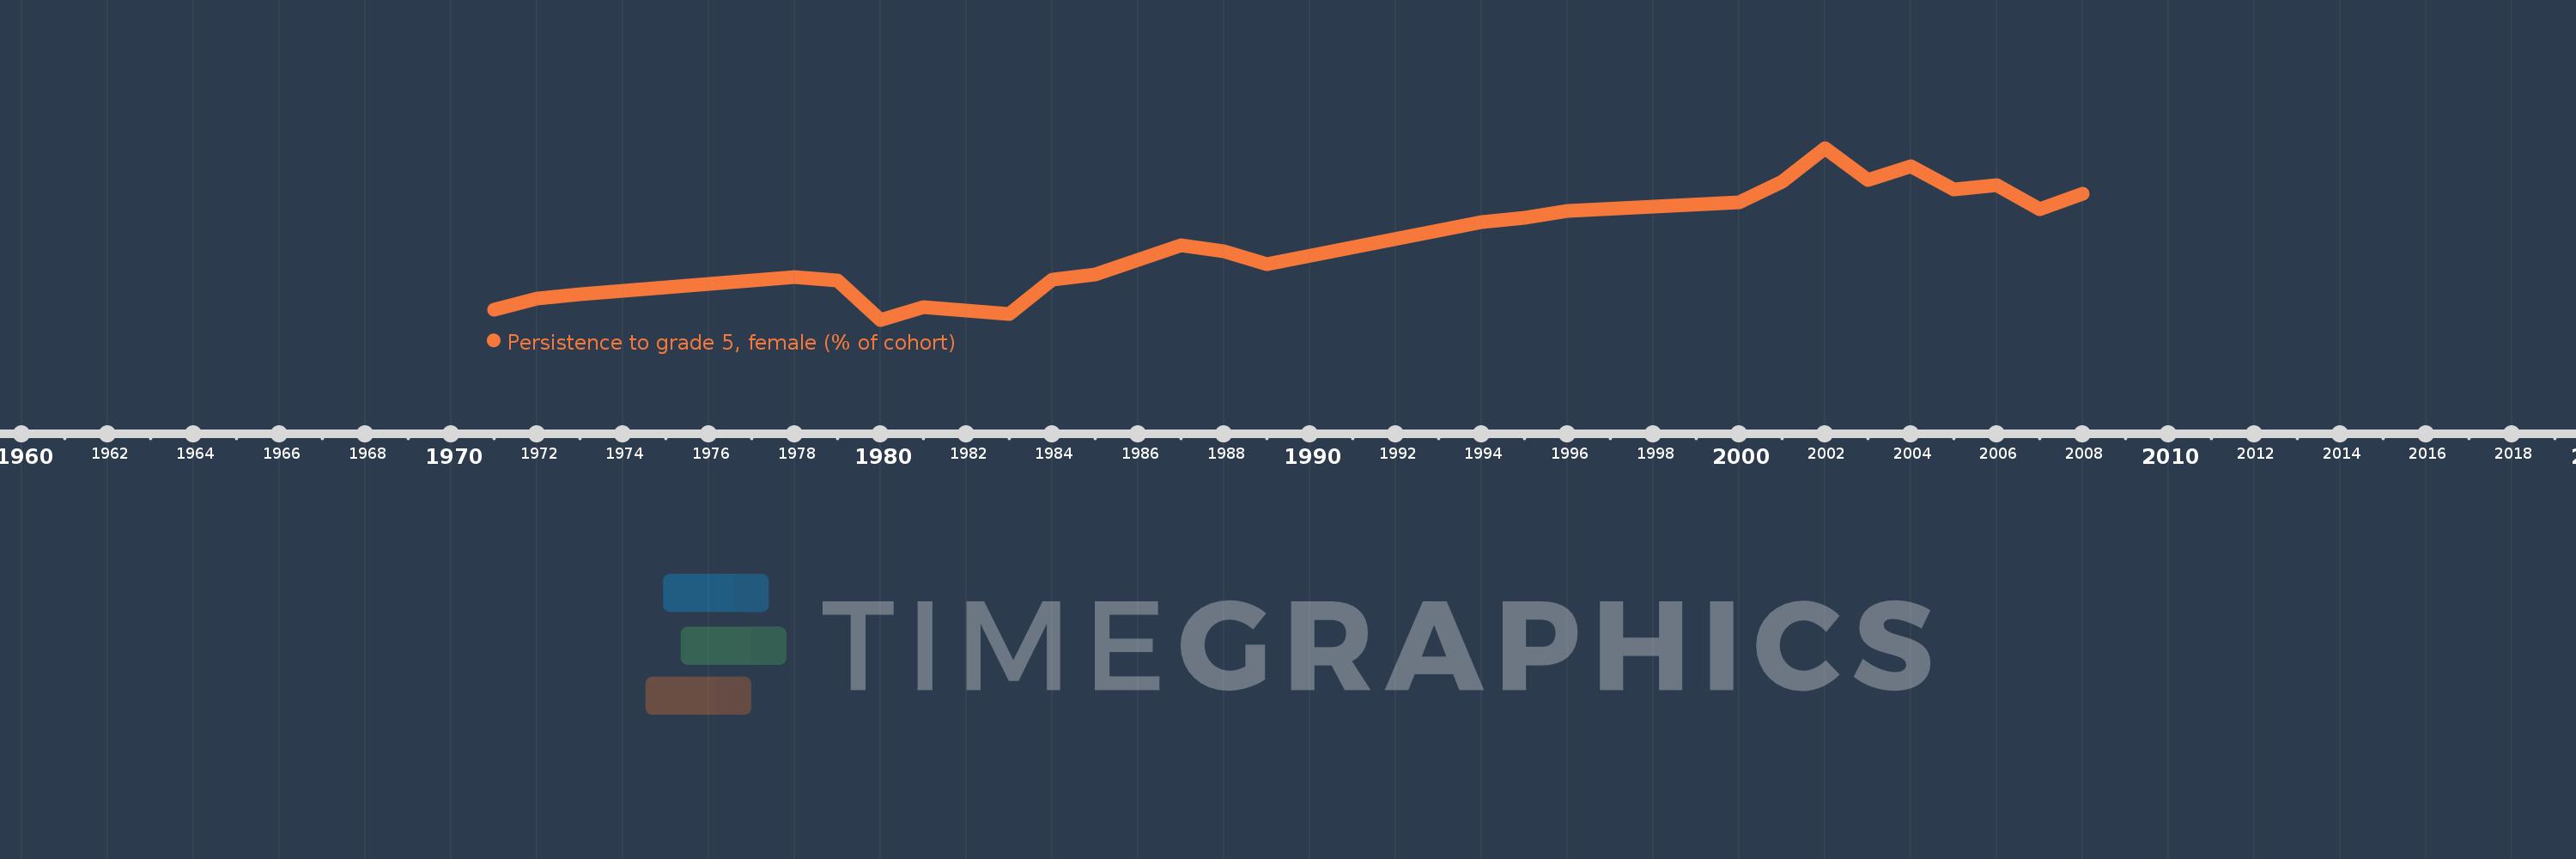
Persistence to grade 5, female (% of cohort)
2008,2007,2006,2005,2004,2003,2002,2001,2000,1996,1995,1994,1989,1988,1987,1985,1984,1983,1981,1980,1979,1978,1974,1973,1972,1971
This statistics in other country:
AfghanistanAlbaniaAlgeriaAndorraAngolaAntigua and BarbudaArab WorldArgentinaArubaBahamas, TheBahrainBangladeshBarbadosBelgiumBelizeBeninBermudaBhutanBoliviaBosnia and HerzegovinaBotswanaBrunei DarussalamBurkina FasoBurundiCabo VerdeCambodiaCameroonCanadaCaribbean small statesCayman IslandsCentral African RepublicChadChileChinaColombiaComorosCongo, Dem. Rep.Congo, Rep.Costa RicaCote d'IvoireCubaCyprusCzech RepublicDenmarkDjiboutiDominicaDominican RepublicEarly-demographic dividendEast Asia & PacificEast Asia & Pacific (excluding high income)East Asia & Pacific (IDA & IBRD countries)EcuadorEgypt, Arab Rep.El SalvadorEquatorial GuineaEritreaEstoniaEthiopiaFijiFinlandFranceGabonGambia, TheGeorgiaGhanaGreeceGrenadaGuatemalaGuineaGuinea-BissauGuyanaHaitiHeavily indebted poor countries (HIPC)HondurasHong Kong SAR, ChinaHungaryIcelandIDA blendIDA onlyIDA totalIndiaIndonesiaIran, Islamic Rep.IraqIrelandIsraelItalyJamaicaJapanJordanKenyaKiribatiKorea, Rep.KuwaitLao PDRLate-demographic dividendLatviaLeast developed countries: UN classificationLebanonLesothoLiberiaLibyaLiechtensteinLow incomeLower middle incomeLuxembourgMacao SAR, ChinaMadagascarMalawiMalaysiaMaldivesMaliMaltaMarshall IslandsMauritaniaMauritiusMexicoMiddle East & North AfricaMiddle East & North Africa (excluding high income)Middle East & North Africa (IDA & IBRD countries)MontenegroMoroccoMozambiqueMyanmarNamibiaNepalNetherlandsNicaraguaNigerNigeriaNorwayOmanOther small statesPacific island small statesPakistanPanamaPapua New GuineaParaguayPeruPhilippinesPolandPortugalPre-demographic dividendQatarRwandaSamoaSan MarinoSao Tome and PrincipeSaudi ArabiaSenegalSeychellesSierra LeoneSingaporeSloveniaSolomon IslandsSouth AfricaSouth AsiaSouth Asia (IDA & IBRD)SpainSri LankaSt. Kitts and NevisSt. LuciaSt. Vincent and the GrenadinesSub-Saharan Africa Sub-Saharan Africa (excluding high income)Sub-Saharan Africa (IDA & IBRD countries)SudanSurinameSwazilandSwedenSwitzerlandSyrian Arab RepublicTanzaniaThailandTimor-LesteTogoTongaTrinidad and TobagoTunisiaTurkeyUgandaUnited Arab EmiratesUpper middle incomeUruguayVanuatuVenezuela, RBVietnamYemen, Rep.ZambiaZimbabwe Timeline:
This timeline shows a graph from 1971 to 2008 of Nicaragua. No data until 1970. Number of actual observations by date: 26.
Source name:
World Development Indicators
Source organization:
United Nations Educational, Scientific, and Cultural Organization (UNESCO) Institute for Statistics.
Categories, topics:
Education, Gender
Last updated:
apr 23, 2017
Indicators value changes by year
Minimum:
21.762
jan 1, 1980
Maximum:
67.278
jan 1, 2002
At the date of observation
Value
Absolute change
Change from previous value
jan 1, 1971
24.425
+24.425
0.0%
jan 1, 1972
27.36
+2.934
12.01%
jan 1, 1973
28.54
+1.181
4.32%
jan 1, 1974
29.396
+0.856
3.0%
jan 1, 1978
33.137
+3.741
12.72%
jan 1, 1979
32.266
-0.871
-2.63%
jan 1, 1980
21.762
-10.504
-32.56%
jan 1, 1981
25.052
+3.29
15.12%
jan 1, 1983
23.28
-1.771
-7.07%
jan 1, 1984
32.453
+9.173
39.4%
jan 1, 1985
33.805
+1.352
4.17%
jan 1, 1987
41.574
+7.769
22.98%
jan 1, 1988
39.923
-1.651
-3.97%
jan 1, 1989
36.556
-3.367
-8.43%
jan 1, 1994
47.718
+11.162
30.54%
jan 1, 1995
48.827
+1.108
2.32%
jan 1, 1996
50.694
+1.867
3.82%
jan 1, 2000
52.92
+2.226
4.39%
jan 1, 2001
58.273
+5.354
10.12%
jan 1, 2002
67.278
+9.005
15.45%
jan 1, 2003
58.798
-8.48
-12.6%
jan 1, 2004
62.537
+3.74
6.36%
jan 1, 2005
56.389
-6.148
-9.83%
jan 1, 2006
57.337
+0.948
1.68%
jan 1, 2007
51.067
-6.27
-10.94%
jan 1, 2008
55.164
+4.097
8.02%
Ranking of countries by current statistics by years


Comments: