29
/
en
AIzaSyAYiBZKx7MnpbEhh9jyipgxe19OcubqV5w
April 1, 2024
255603
Swaziland
SWZ
true
2
1
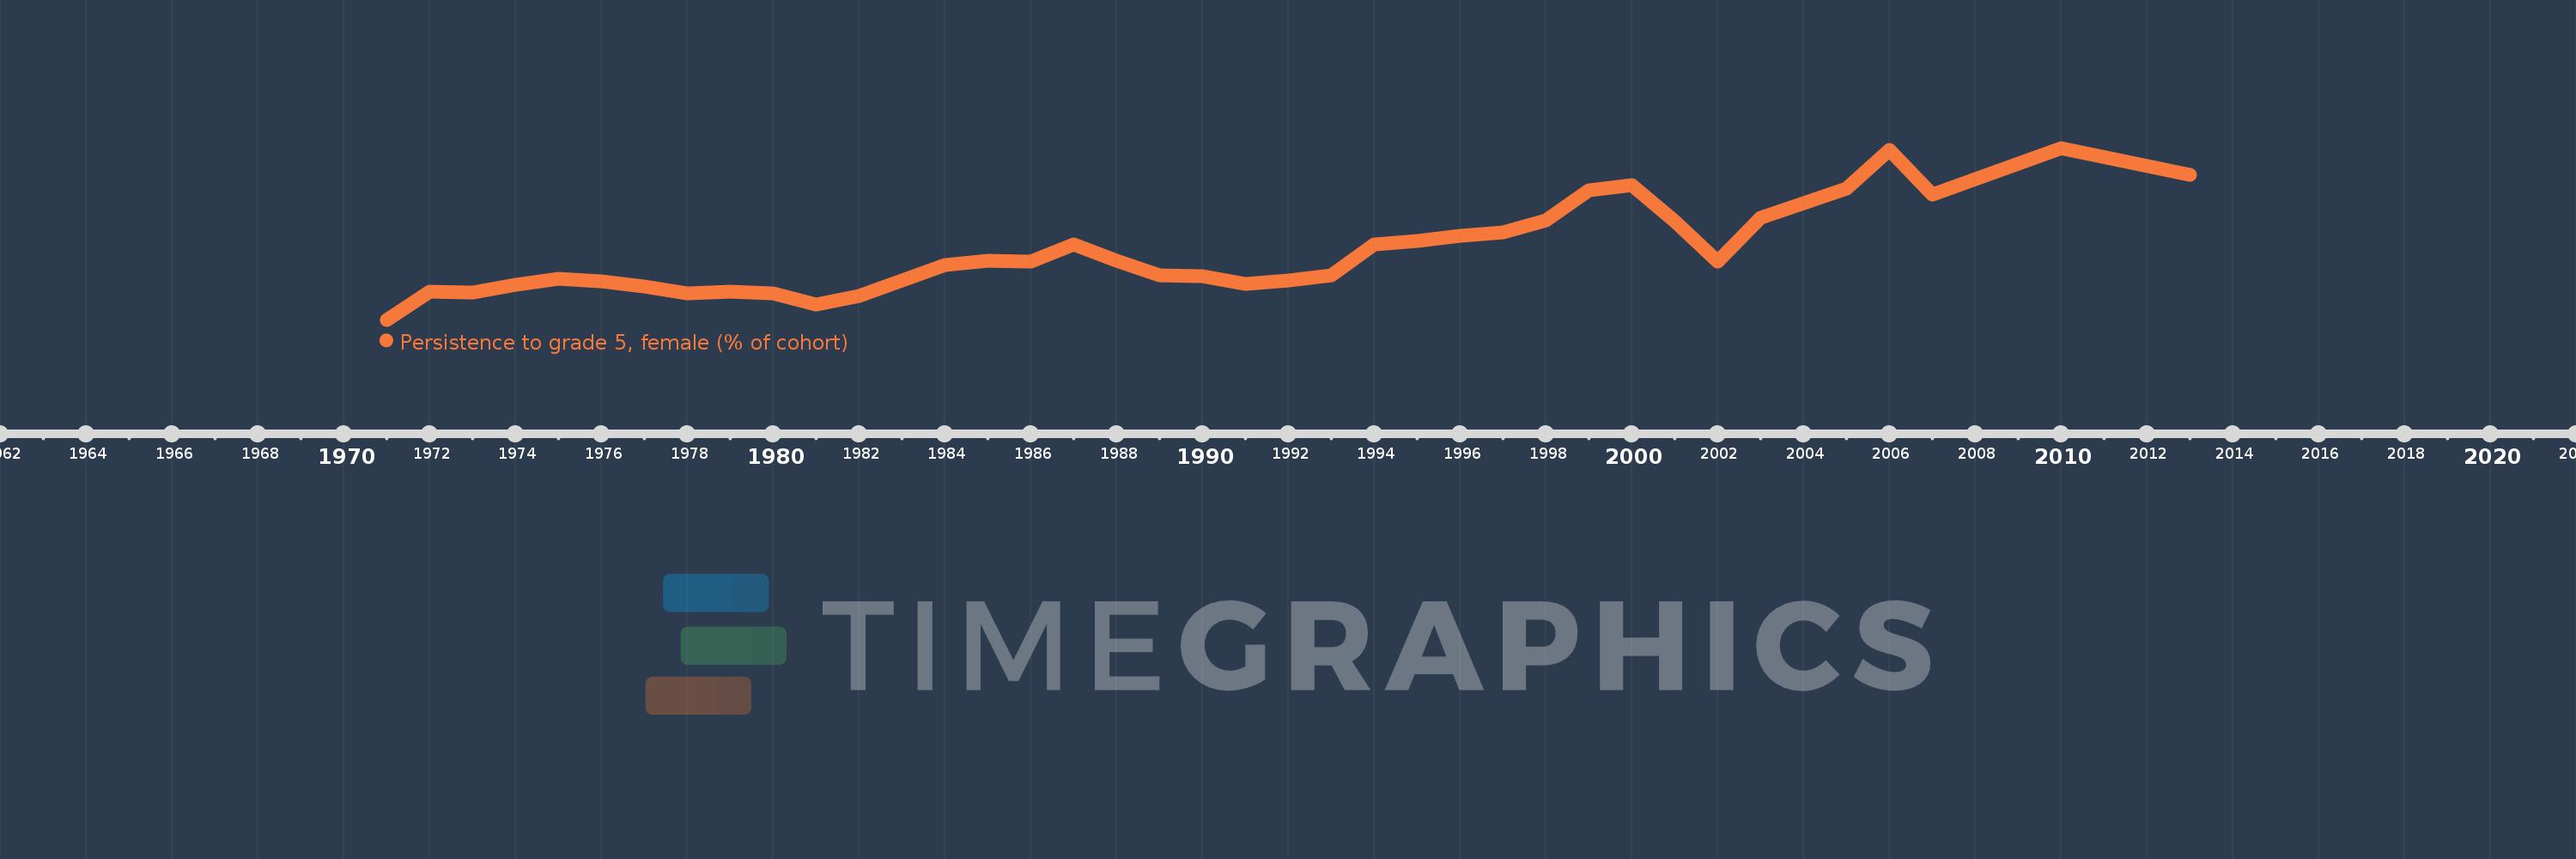
Persistence to grade 5, female (% of cohort)
2013,2010,2007,2006,2005,2003,2002,2001,2000,1999,1998,1997,1996,1995,1994,1993,1992,1991,1990,1989,1988,1987,1986,1985,1984,1983,1982,1981,1980,1979,1978,1977,1976,1975,1974,1973,1972,1971
This statistics in other country:
AfghanistanAlbaniaAlgeriaAndorraAngolaAntigua and BarbudaArab WorldArgentinaArubaBahamas, TheBahrainBangladeshBarbadosBelgiumBelizeBeninBermudaBhutanBoliviaBosnia and HerzegovinaBotswanaBrunei DarussalamBurkina FasoBurundiCabo VerdeCambodiaCameroonCanadaCaribbean small statesCayman IslandsCentral African RepublicChadChileChinaColombiaComorosCongo, Dem. Rep.Congo, Rep.Costa RicaCote d'IvoireCubaCyprusCzech RepublicDenmarkDjiboutiDominicaDominican RepublicEarly-demographic dividendEast Asia & PacificEast Asia & Pacific (excluding high income)East Asia & Pacific (IDA & IBRD countries)EcuadorEgypt, Arab Rep.El SalvadorEquatorial GuineaEritreaEstoniaEthiopiaFijiFinlandFranceGabonGambia, TheGeorgiaGhanaGreeceGrenadaGuatemalaGuineaGuinea-BissauGuyanaHaitiHeavily indebted poor countries (HIPC)HondurasHong Kong SAR, ChinaHungaryIcelandIDA blendIDA onlyIDA totalIndiaIndonesiaIran, Islamic Rep.IraqIrelandIsraelItalyJamaicaJapanJordanKenyaKiribatiKorea, Rep.KuwaitLao PDRLate-demographic dividendLatviaLeast developed countries: UN classificationLebanonLesothoLiberiaLibyaLiechtensteinLow incomeLower middle incomeLuxembourgMacao SAR, ChinaMadagascarMalawiMalaysiaMaldivesMaliMaltaMarshall IslandsMauritaniaMauritiusMexicoMiddle East & North AfricaMiddle East & North Africa (excluding high income)Middle East & North Africa (IDA & IBRD countries)MontenegroMoroccoMozambiqueMyanmarNamibiaNepalNetherlandsNicaraguaNigerNigeriaNorwayOmanOther small statesPacific island small statesPakistanPanamaPapua New GuineaParaguayPeruPhilippinesPolandPortugalPre-demographic dividendQatarRwandaSamoaSan MarinoSao Tome and PrincipeSaudi ArabiaSenegalSeychellesSierra LeoneSingaporeSloveniaSolomon IslandsSouth AfricaSouth AsiaSouth Asia (IDA & IBRD)SpainSri LankaSt. Kitts and NevisSt. LuciaSt. Vincent and the GrenadinesSub-Saharan Africa Sub-Saharan Africa (excluding high income)Sub-Saharan Africa (IDA & IBRD countries)SudanSurinameSwazilandSwedenSwitzerlandSyrian Arab RepublicTanzaniaThailandTimor-LesteTogoTongaTrinidad and TobagoTunisiaTurkeyUgandaUnited Arab EmiratesUpper middle incomeUruguayVanuatuVenezuela, RBVietnamYemen, Rep.ZambiaZimbabwe Timeline:
This timeline shows a graph from 1971 to 2013 of Swaziland. No data until 1970. Number of actual observations by date: 38.
Source name:
World Development Indicators
Source organization:
United Nations Educational, Scientific, and Cultural Organization (UNESCO) Institute for Statistics.
Categories, topics:
Education, Gender
Last updated:
apr 23, 2017
Indicators value changes by year
Minimum:
54.674
jan 1, 1971
Maximum:
97.419
jan 1, 2010
At the date of observation
Value
Absolute change
Change from previous value
jan 1, 1971
54.674
+54.674
0.0%
jan 1, 1972
61.621
+6.948
12.71%
jan 1, 1973
61.432
-0.189
-0.31%
jan 1, 1974
63.46
+2.028
3.3%
jan 1, 1975
64.816
+1.356
2.14%
jan 1, 1976
64.327
-0.49
-0.76%
jan 1, 1977
62.884
-1.443
-2.24%
jan 1, 1978
61.318
-1.566
-2.49%
jan 1, 1979
61.652
+0.335
0.55%
jan 1, 1980
61.252
-0.4
-0.65%
jan 1, 1981
58.447
-2.805
-4.58%
jan 1, 1982
60.637
+2.19
3.75%
jan 1, 1983
64.38
+3.742
6.17%
jan 1, 1984
68.191
+3.811
5.92%
jan 1, 1985
69.439
+1.248
1.83%
jan 1, 1986
69.08
-0.358
-0.52%
jan 1, 1987
73.481
+4.4
6.37%
jan 1, 1988
69.307
-4.174
-5.68%
jan 1, 1989
65.829
-3.478
-5.02%
jan 1, 1990
65.438
-0.391
-0.59%
jan 1, 1991
63.528
-1.91
-2.92%
jan 1, 1992
64.41
+0.882
1.39%
jan 1, 1993
65.672
+1.261
1.96%
jan 1, 1994
73.454
+7.782
11.85%
jan 1, 1995
74.282
+0.829
1.13%
jan 1, 1996
75.583
+1.3
1.75%
jan 1, 1997
76.383
+0.801
1.06%
jan 1, 1998
79.344
+2.96
3.88%
jan 1, 1999
86.907
+7.564
9.53%
jan 1, 2000
88.129
+1.222
1.41%
jan 1, 2001
79.266
-8.863
-10.06%
jan 1, 2002
69.235
-10.031
-12.66%
jan 1, 2003
79.969
+10.735
15.5%
jan 1, 2005
87.323
+7.354
9.2%
jan 1, 2006
96.881
+9.558
10.94%
jan 1, 2007
85.907
-10.974
-11.33%
jan 1, 2010
97.419
+11.512
13.4%
jan 1, 2013
90.747
-6.672
-6.85%
Ranking of countries by current statistics by years


Comments: