30
/
AIzaSyAYiBZKx7MnpbEhh9jyipgxe19OcubqV5w
April 1, 2024
100379
Cameroon
CMR
true
2
1
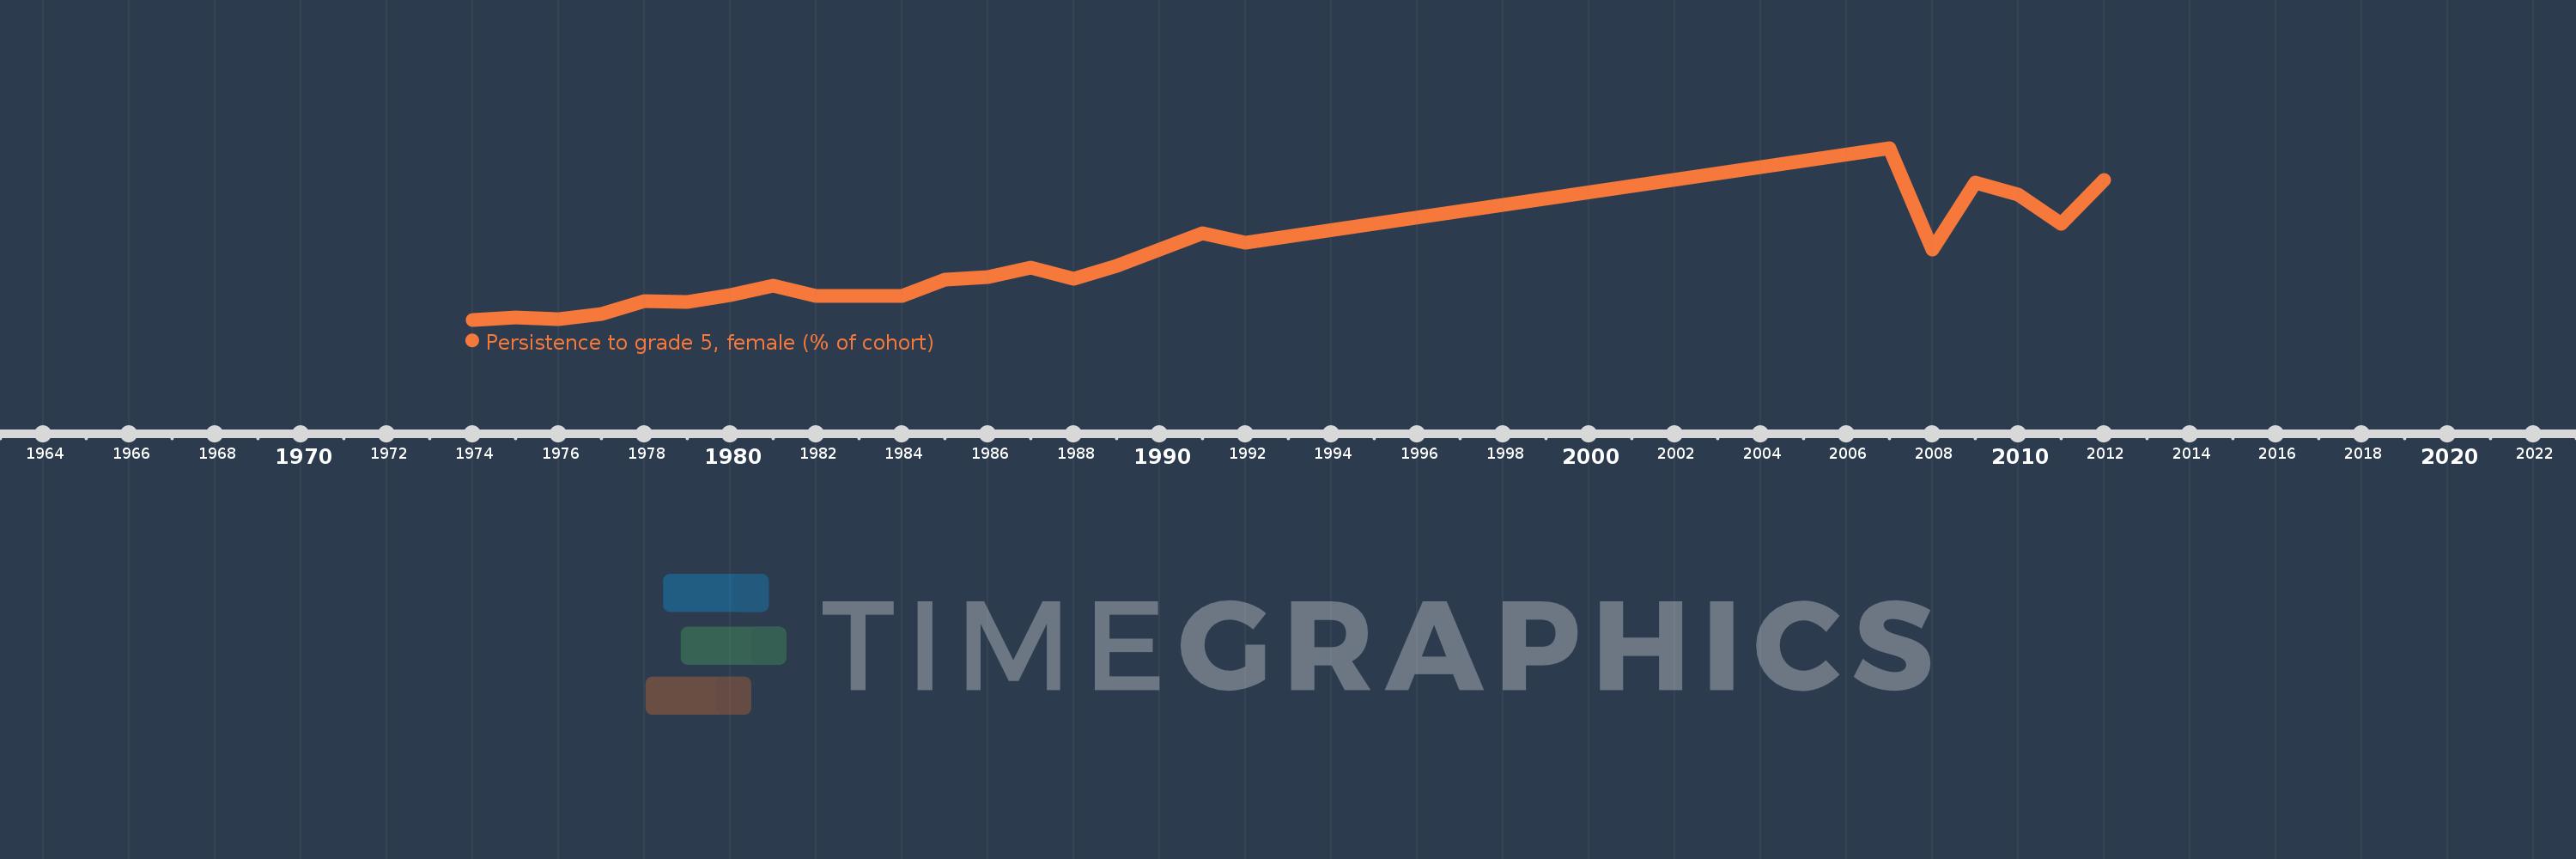
Persistence to grade 5, female (% of cohort)
2012,2011,2010,2009,2008,2007,1992,1991,1989,1988,1987,1986,1985,1984,1983,1982,1981,1980,1979,1978,1977,1976,1975,1974
