29
/
en
AIzaSyAYiBZKx7MnpbEhh9jyipgxe19OcubqV5w
April 1, 2024
193460
Mauritania
MRT
true
2
1
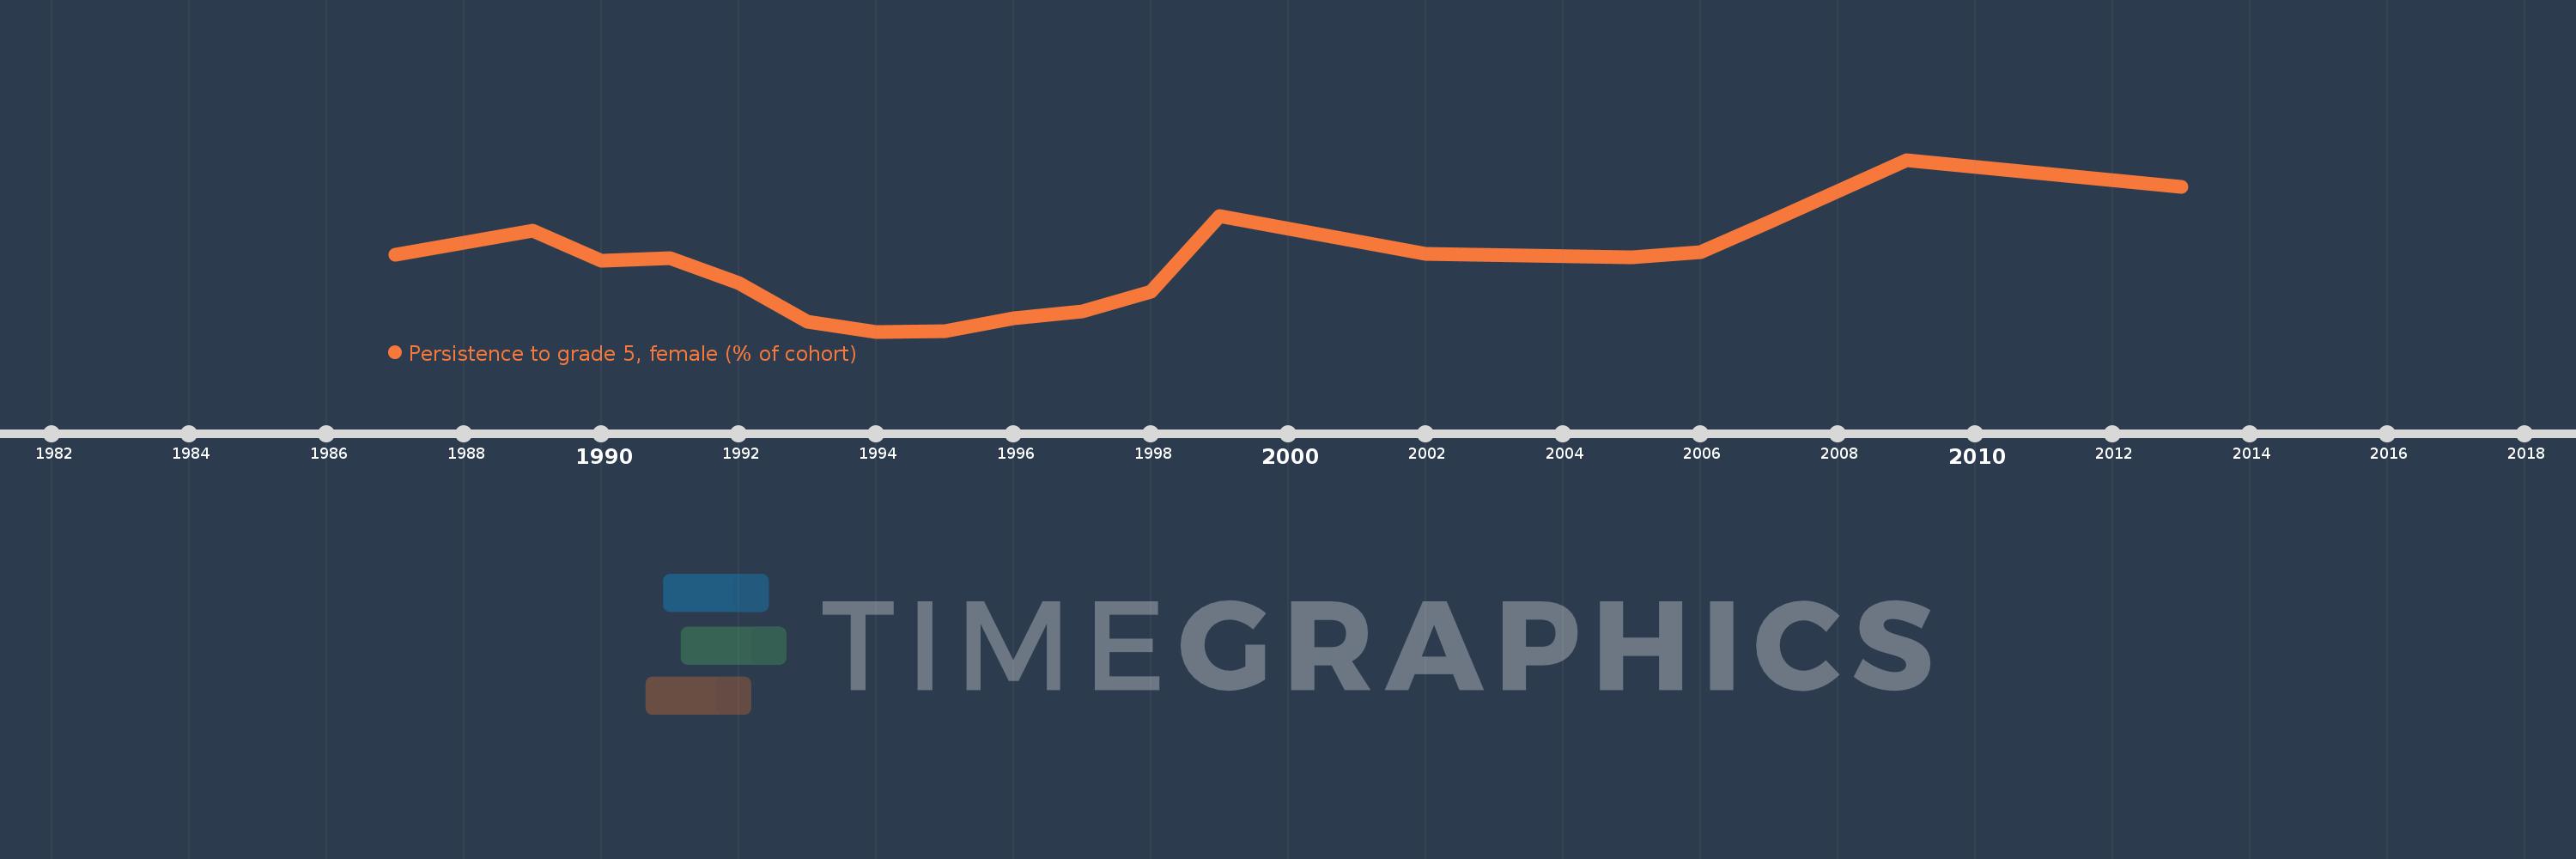
Persistence to grade 5, female (% of cohort)
2013,2009,2007,2006,2005,2002,1999,1998,1997,1996,1995,1994,1993,1992,1991,1990,1989,1987
This statistics in other country:
AfghanistanAlbaniaAlgeriaAndorraAngolaAntigua and BarbudaArab WorldArgentinaArubaBahamas, TheBahrainBangladeshBarbadosBelgiumBelizeBeninBermudaBhutanBoliviaBosnia and HerzegovinaBotswanaBrunei DarussalamBurkina FasoBurundiCabo VerdeCambodiaCameroonCanadaCaribbean small statesCayman IslandsCentral African RepublicChadChileChinaColombiaComorosCongo, Dem. Rep.Congo, Rep.Costa RicaCote d'IvoireCubaCyprusCzech RepublicDenmarkDjiboutiDominicaDominican RepublicEarly-demographic dividendEast Asia & PacificEast Asia & Pacific (excluding high income)East Asia & Pacific (IDA & IBRD countries)EcuadorEgypt, Arab Rep.El SalvadorEquatorial GuineaEritreaEstoniaEthiopiaFijiFinlandFranceGabonGambia, TheGeorgiaGhanaGreeceGrenadaGuatemalaGuineaGuinea-BissauGuyanaHaitiHeavily indebted poor countries (HIPC)HondurasHong Kong SAR, ChinaHungaryIcelandIDA blendIDA onlyIDA totalIndiaIndonesiaIran, Islamic Rep.IraqIrelandIsraelItalyJamaicaJapanJordanKenyaKiribatiKorea, Rep.KuwaitLao PDRLate-demographic dividendLatviaLeast developed countries: UN classificationLebanonLesothoLiberiaLibyaLiechtensteinLow incomeLower middle incomeLuxembourgMacao SAR, ChinaMadagascarMalawiMalaysiaMaldivesMaliMaltaMarshall IslandsMauritaniaMauritiusMexicoMiddle East & North AfricaMiddle East & North Africa (excluding high income)Middle East & North Africa (IDA & IBRD countries)MontenegroMoroccoMozambiqueMyanmarNamibiaNepalNetherlandsNicaraguaNigerNigeriaNorwayOmanOther small statesPacific island small statesPakistanPanamaPapua New GuineaParaguayPeruPhilippinesPolandPortugalPre-demographic dividendQatarRwandaSamoaSan MarinoSao Tome and PrincipeSaudi ArabiaSenegalSeychellesSierra LeoneSingaporeSloveniaSolomon IslandsSouth AfricaSouth AsiaSouth Asia (IDA & IBRD)SpainSri LankaSt. Kitts and NevisSt. LuciaSt. Vincent and the GrenadinesSub-Saharan Africa Sub-Saharan Africa (excluding high income)Sub-Saharan Africa (IDA & IBRD countries)SudanSurinameSwazilandSwedenSwitzerlandSyrian Arab RepublicTanzaniaThailandTimor-LesteTogoTongaTrinidad and TobagoTunisiaTurkeyUgandaUnited Arab EmiratesUpper middle incomeUruguayVanuatuVenezuela, RBVietnamYemen, Rep.ZambiaZimbabwe Timeline:
This timeline shows a graph from 1987 to 2013 of Mauritania. No data until 1986. Number of actual observations by date: 18.
Source name:
World Development Indicators
Source organization:
United Nations Educational, Scientific, and Cultural Organization (UNESCO) Institute for Statistics.
Categories, topics:
Education, Gender
Last updated:
apr 23, 2017
Indicators value changes by year
Minimum:
32.901
jan 1, 1994
Maximum:
83.286
jan 1, 2009
At the date of observation
Value
Absolute change
Change from previous value
jan 1, 1987
55.506
+55.506
0.0%
jan 1, 1989
62.481
+6.975
12.57%
jan 1, 1990
53.667
-8.813
-14.11%
jan 1, 1991
54.547
+0.879
1.64%
jan 1, 1992
47.028
-7.519
-13.78%
jan 1, 1993
35.677
-11.351
-24.14%
jan 1, 1994
32.901
-2.775
-7.78%
jan 1, 1995
33.01
+0.109
0.33%
jan 1, 1996
36.87
+3.86
11.69%
jan 1, 1997
38.875
+2.005
5.44%
jan 1, 1998
44.595
+5.72
14.71%
jan 1, 1999
66.9
+22.305
50.02%
jan 1, 2002
55.823
-11.078
-16.56%
jan 1, 2005
54.733
-1.089
-1.95%
jan 1, 2006
56.167
+1.434
2.62%
jan 1, 2007
64.938
+8.771
15.62%
jan 1, 2009
83.286
+18.349
28.26%
jan 1, 2013
75.31
-7.977
-9.58%
Ranking of countries by current statistics by years


Comments: