29
/
en
AIzaSyAYiBZKx7MnpbEhh9jyipgxe19OcubqV5w
April 1, 2024
178086
Lesotho
LSO
true
2
1
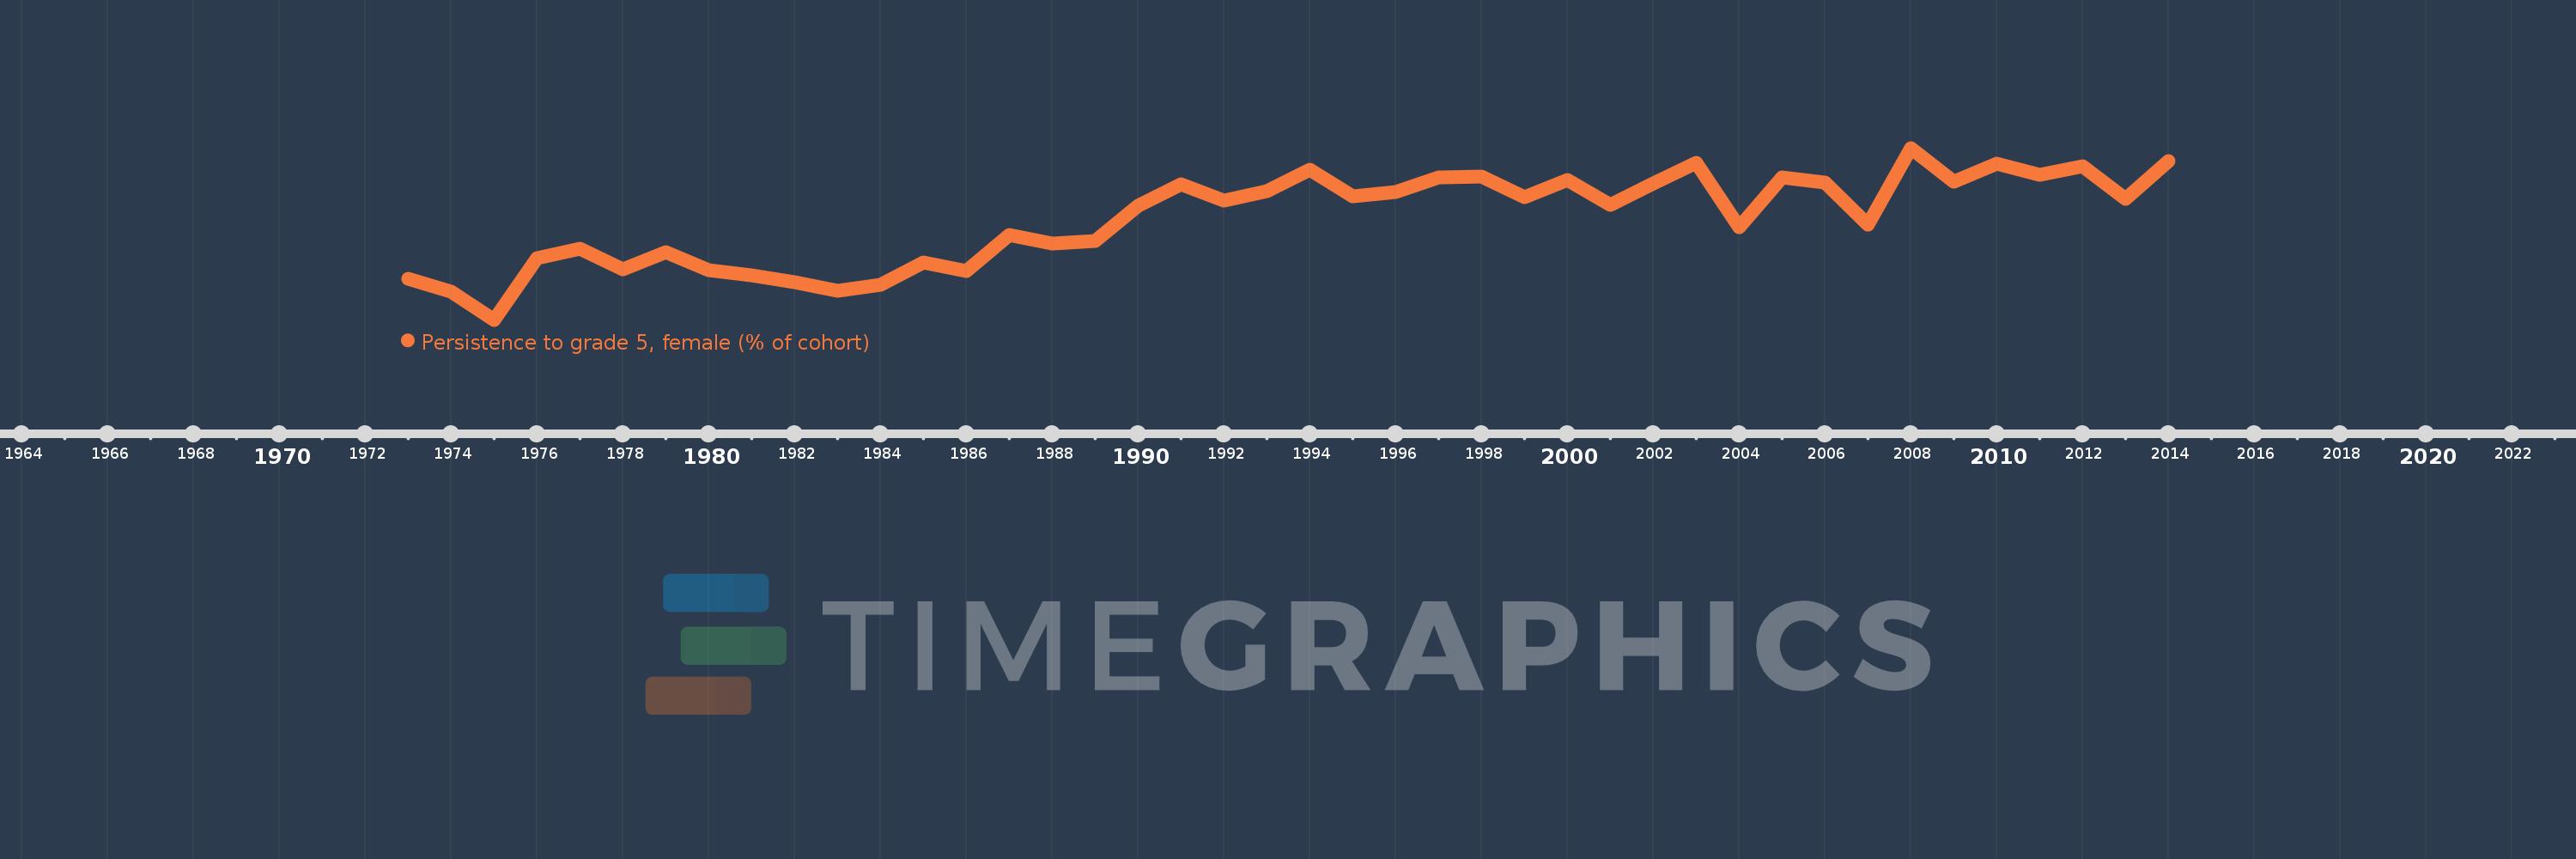
Persistence to grade 5, female (% of cohort)
2014,2013,2012,2011,2010,2009,2008,2007,2006,2005,2004,2003,2002,2001,2000,1999,1998,1997,1996,1995,1994,1993,1992,1991,1990,1989,1988,1987,1986,1985,1984,1983,1982,1981,1980,1979,1978,1977,1976,1975,1974,1973
This statistics in other country:
AfghanistanAlbaniaAlgeriaAndorraAngolaAntigua and BarbudaArab WorldArgentinaArubaBahamas, TheBahrainBangladeshBarbadosBelgiumBelizeBeninBermudaBhutanBoliviaBosnia and HerzegovinaBotswanaBrunei DarussalamBurkina FasoBurundiCabo VerdeCambodiaCameroonCanadaCaribbean small statesCayman IslandsCentral African RepublicChadChileChinaColombiaComorosCongo, Dem. Rep.Congo, Rep.Costa RicaCote d'IvoireCubaCyprusCzech RepublicDenmarkDjiboutiDominicaDominican RepublicEarly-demographic dividendEast Asia & PacificEast Asia & Pacific (excluding high income)East Asia & Pacific (IDA & IBRD countries)EcuadorEgypt, Arab Rep.El SalvadorEquatorial GuineaEritreaEstoniaEthiopiaFijiFinlandFranceGabonGambia, TheGeorgiaGhanaGreeceGrenadaGuatemalaGuineaGuinea-BissauGuyanaHaitiHeavily indebted poor countries (HIPC)HondurasHong Kong SAR, ChinaHungaryIcelandIDA blendIDA onlyIDA totalIndiaIndonesiaIran, Islamic Rep.IraqIrelandIsraelItalyJamaicaJapanJordanKenyaKiribatiKorea, Rep.KuwaitLao PDRLate-demographic dividendLatviaLeast developed countries: UN classificationLebanonLesothoLiberiaLibyaLiechtensteinLow incomeLower middle incomeLuxembourgMacao SAR, ChinaMadagascarMalawiMalaysiaMaldivesMaliMaltaMarshall IslandsMauritaniaMauritiusMexicoMiddle East & North AfricaMiddle East & North Africa (excluding high income)Middle East & North Africa (IDA & IBRD countries)MontenegroMoroccoMozambiqueMyanmarNamibiaNepalNetherlandsNicaraguaNigerNigeriaNorwayOmanOther small statesPacific island small statesPakistanPanamaPapua New GuineaParaguayPeruPhilippinesPolandPortugalPre-demographic dividendQatarRwandaSamoaSan MarinoSao Tome and PrincipeSaudi ArabiaSenegalSeychellesSierra LeoneSingaporeSloveniaSolomon IslandsSouth AfricaSouth AsiaSouth Asia (IDA & IBRD)SpainSri LankaSt. Kitts and NevisSt. LuciaSt. Vincent and the GrenadinesSub-Saharan Africa Sub-Saharan Africa (excluding high income)Sub-Saharan Africa (IDA & IBRD countries)SudanSurinameSwazilandSwedenSwitzerlandSyrian Arab RepublicTanzaniaThailandTimor-LesteTogoTongaTrinidad and TobagoTunisiaTurkeyUgandaUnited Arab EmiratesUpper middle incomeUruguayVanuatuVenezuela, RBVietnamYemen, Rep.ZambiaZimbabwe Timeline:
This timeline shows a graph from 1973 to 2014 of Lesotho. No data until 1972. Number of actual observations by date: 42.
Source name:
World Development Indicators
Source organization:
United Nations Educational, Scientific, and Cultural Organization (UNESCO) Institute for Statistics.
Categories, topics:
Education, Gender
Last updated:
apr 23, 2017
Indicators value changes by year
Minimum:
45.345
jan 1, 1975
Maximum:
88.752
jan 1, 2008
At the date of observation
Value
Absolute change
Change from previous value
jan 1, 1973
55.759
+55.759
0.0%
jan 1, 1974
52.514
-3.245
-5.82%
jan 1, 1975
45.345
-7.169
-13.65%
jan 1, 1976
60.908
+15.563
34.32%
jan 1, 1977
63.347
+2.439
4.0%
jan 1, 1978
58.184
-5.163
-8.15%
jan 1, 1979
62.472
+4.288
7.37%
jan 1, 1980
57.943
-4.529
-7.25%
jan 1, 1981
56.616
-1.327
-2.29%
jan 1, 1982
54.937
-1.679
-2.96%
jan 1, 1983
52.62
-2.318
-4.22%
jan 1, 1984
54.237
+1.617
3.07%
jan 1, 1985
59.785
+5.549
10.23%
jan 1, 1986
57.587
-2.199
-3.68%
jan 1, 1987
66.799
+9.213
16.0%
jan 1, 1988
64.607
-2.193
-3.28%
jan 1, 1989
65.158
+0.552
0.85%
jan 1, 1990
74.063
+8.905
13.67%
jan 1, 1991
79.621
+5.558
7.5%
jan 1, 1992
75.524
-4.096
-5.14%
jan 1, 1993
77.878
+2.353
3.12%
jan 1, 1994
83.223
+5.345
6.86%
jan 1, 1995
76.599
-6.624
-7.96%
jan 1, 1996
77.569
+0.97
1.27%
jan 1, 1997
81.29
+3.72
4.8%
jan 1, 1998
81.625
+0.336
0.41%
jan 1, 1999
76.248
-5.377
-6.59%
jan 1, 2000
80.738
+4.489
5.89%
jan 1, 2001
74.301
-6.437
-7.97%
jan 1, 2002
79.744
+5.443
7.33%
jan 1, 2003
85.044
+5.3
6.65%
jan 1, 2004
68.652
-16.392
-19.27%
jan 1, 2005
81.208
+12.556
18.29%
jan 1, 2006
80.024
-1.184
-1.46%
jan 1, 2007
69.382
-10.642
-13.3%
jan 1, 2008
88.752
+19.37
27.92%
jan 1, 2009
80.205
-8.547
-9.63%
jan 1, 2010
84.845
+4.64
5.79%
jan 1, 2011
81.944
-2.901
-3.42%
jan 1, 2012
84.06
+2.116
2.58%
jan 1, 2013
75.842
-8.218
-9.78%
jan 1, 2014
85.536
+9.693
12.78%
Ranking of countries by current statistics by years


Comments: