30
/
AIzaSyAYiBZKx7MnpbEhh9jyipgxe19OcubqV5w
April 1, 2024
265058
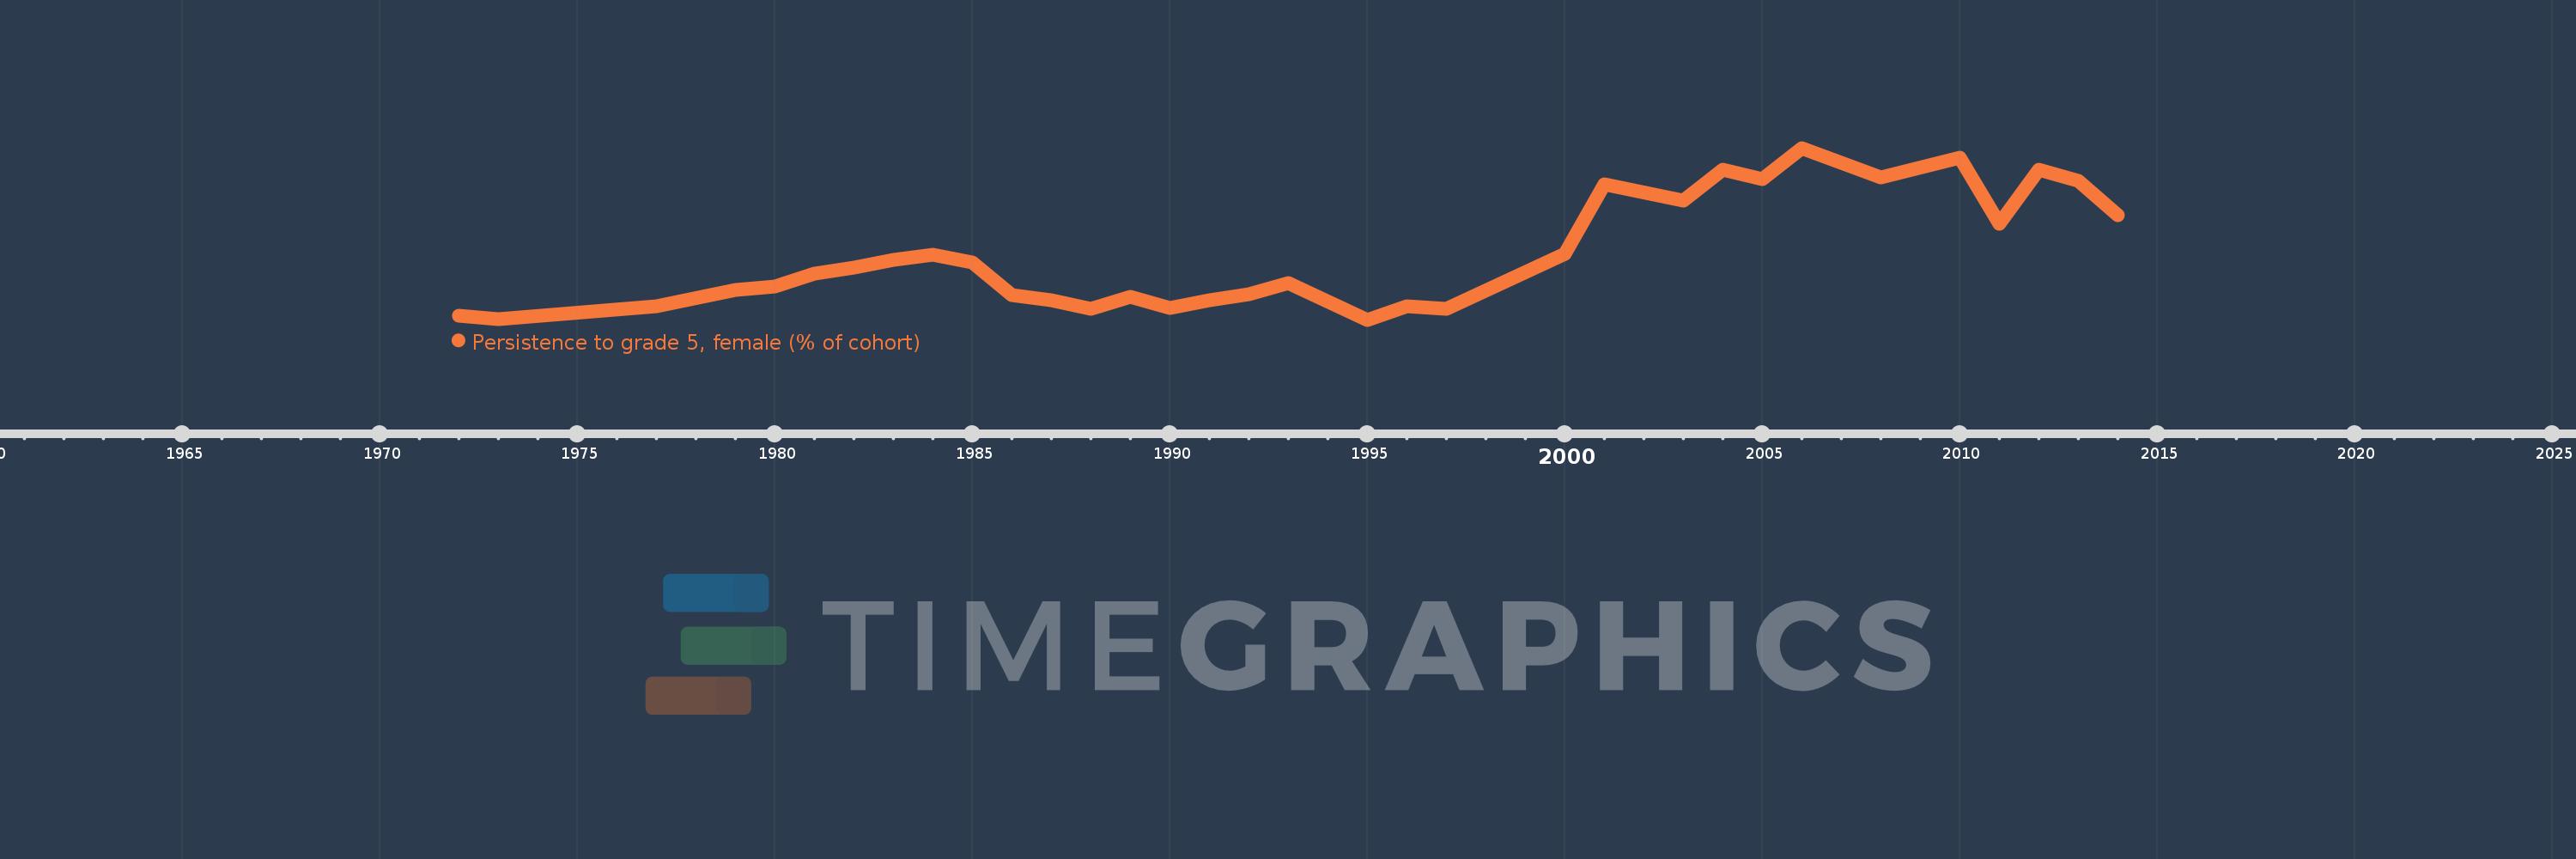
Togo
TGO
true
2
1
Persistence to grade 5, female (% of cohort)
2014,2013,2012,2011,2010,2008,2006,2005,2004,2003,2001,2000,1997,1996,1995,1993,1992,1991,1990,1989,1988,1987,1986,1985,1984,1983,1982,1981,1980,1979,1977,1973,1972
