29
/
en
AIzaSyAYiBZKx7MnpbEhh9jyipgxe19OcubqV5w
April 1, 2024
66023
Algeria
DZA
true
2
1
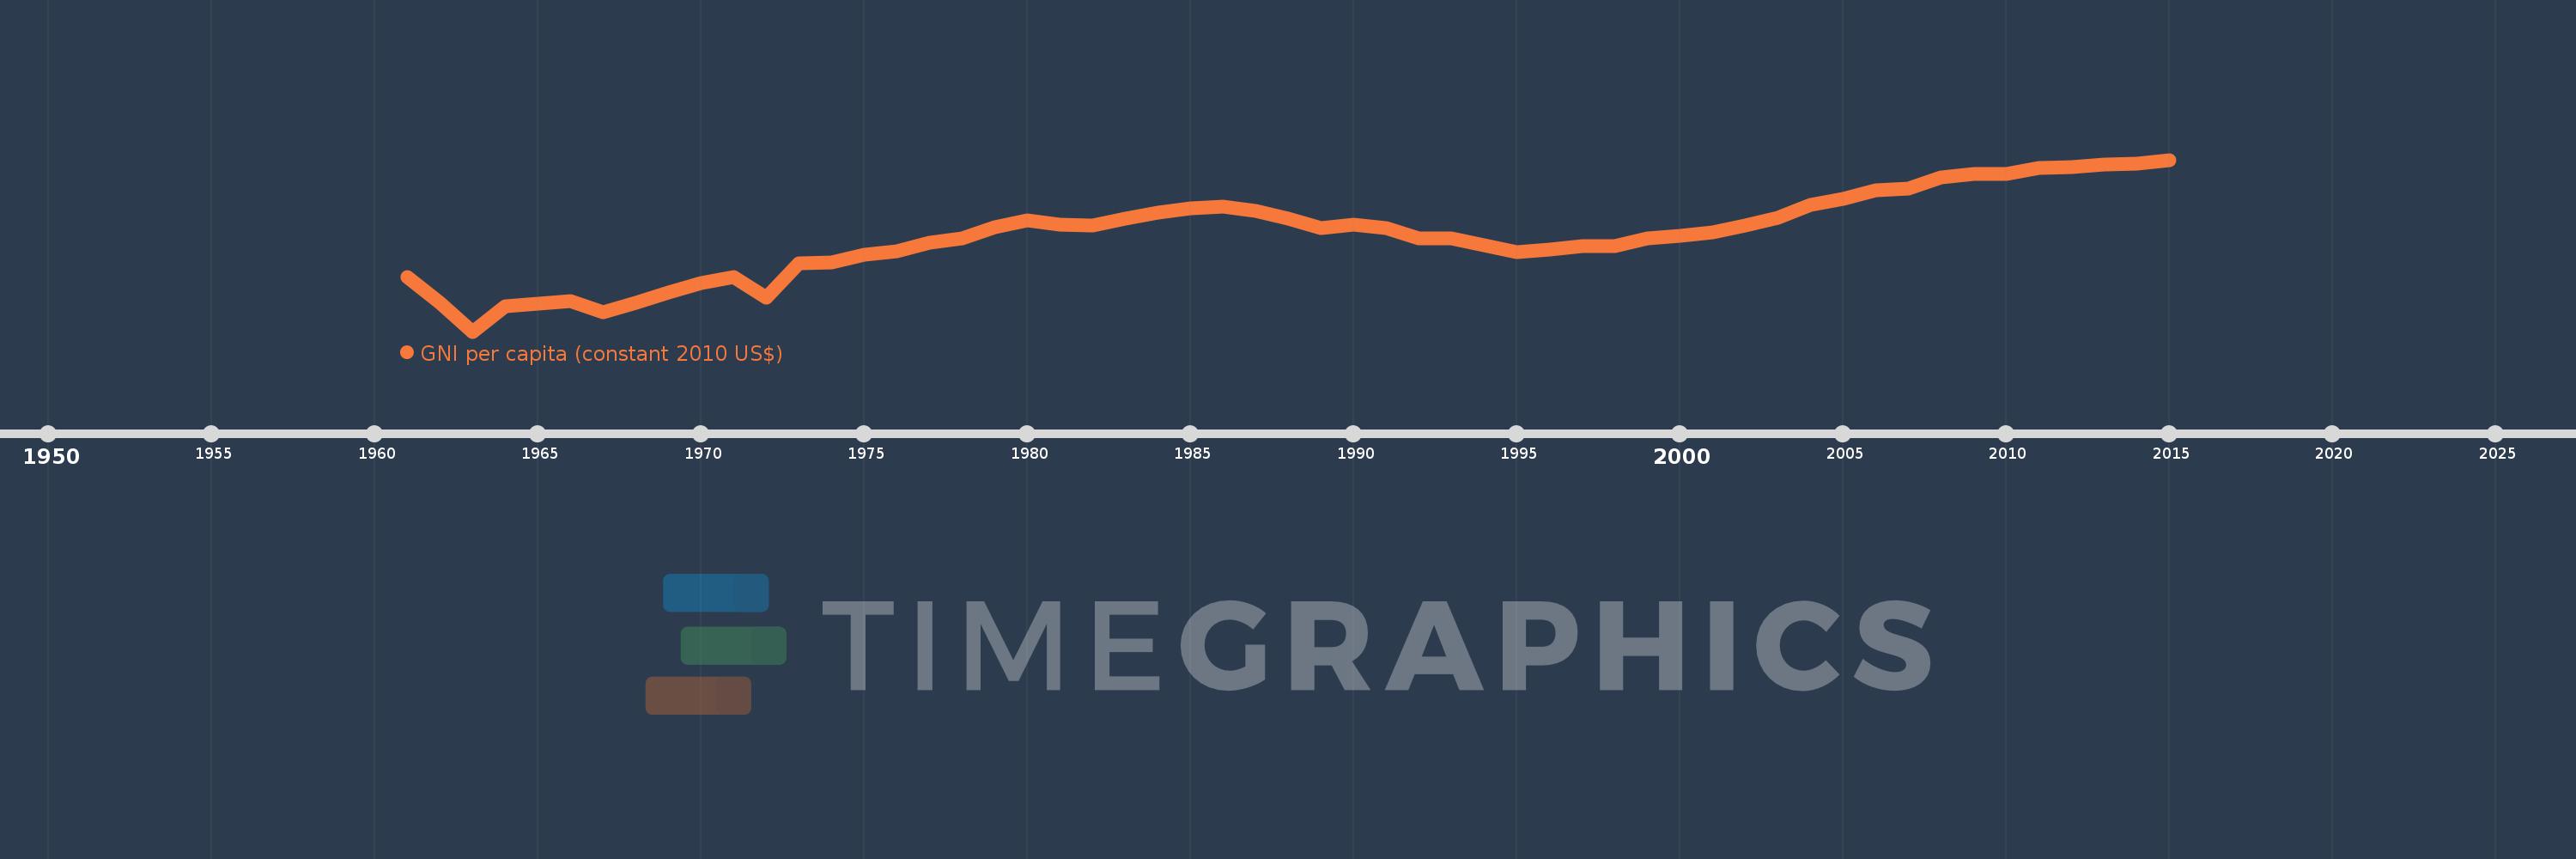
GNI per capita (constant 2010 US$)
2015,2014,2013,2012,2011,2010,2009,2008,2007,2006,2005,2004,2003,2002,2001,2000,1999,1998,1997,1996,1995,1994,1993,1992,1991,1990,1989,1988,1987,1986,1985,1984,1983,1982,1981,1980,1979,1978,1977,1976,1975,1974,1973,1972,1971,1970,1969,1968,1967,1966,1965,1964,1963,1962,1961
This statistics in other country:
AfghanistanAlbaniaAlgeriaAndorraAngolaAntigua and BarbudaArab WorldArgentinaArmeniaAustraliaAustriaAzerbaijanBahamas, TheBahrainBangladeshBarbadosBelarusBelgiumBelizeBeninBermudaBhutanBoliviaBosnia and HerzegovinaBotswanaBrazilBrunei DarussalamBulgariaBurkina FasoBurundiCabo VerdeCambodiaCameroonCanadaCaribbean small statesCentral African RepublicCentral Europe and the BalticsChadChileChinaColombiaComorosCongo, Dem. Rep.Congo, Rep.Costa RicaCote d'IvoireCroatiaCubaCyprusCzech RepublicDenmarkDominicaDominican RepublicEarly-demographic dividendEast Asia & PacificEast Asia & Pacific (excluding high income)East Asia & Pacific (IDA & IBRD countries)EcuadorEgypt, Arab Rep.El SalvadorEquatorial GuineaEritreaEstoniaEthiopiaEuro areaEurope & Central AsiaEurope & Central Asia (excluding high income)Europe & Central Asia (IDA & IBRD countries)European UnionFaroe IslandsFijiFinlandFragile and conflict affected situationsFranceGabonGambia, TheGeorgiaGermanyGhanaGreeceGrenadaGuatemalaGuineaGuinea-BissauGuyanaHaitiHeavily indebted poor countries (HIPC)High incomeHondurasHong Kong SAR, ChinaHungaryIBRD onlyIcelandIDA & IBRD totalIDA blendIDA onlyIDA totalIndiaIndonesiaIran, Islamic Rep.IraqIrelandIsle of ManIsraelItalyJamaicaJapanJordanKazakhstanKenyaKiribatiKorea, Rep.KosovoKuwaitKyrgyz RepublicLao PDRLate-demographic dividendLatin America & Caribbean Latin America & Caribbean (excluding high income)Latin America & the Caribbean (IDA & IBRD countries)LatviaLeast developed countries: UN classificationLebanonLesothoLiberiaLibyaLiechtensteinLithuaniaLow & middle incomeLow incomeLower middle incomeLuxembourgMacao SAR, ChinaMacedonia, FYRMadagascarMalawiMalaysiaMaldivesMaliMaltaMarshall IslandsMauritaniaMauritiusMexicoMicronesia, Fed. Sts.Middle East & North AfricaMiddle East & North Africa (excluding high income)Middle East & North Africa (IDA & IBRD countries)Middle incomeMoldovaMongoliaMontenegroMoroccoMozambiqueMyanmarNamibiaNauruNepalNetherlandsNew ZealandNicaraguaNigerNigeriaNorth AmericaNorwayOECD membersOmanOther small statesPacific island small statesPakistanPalauPanamaPapua New GuineaParaguayPeruPhilippinesPolandPortugalPost-demographic dividendPre-demographic dividendPuerto RicoQatarRomaniaRussian FederationRwandaSamoaSao Tome and PrincipeSaudi ArabiaSenegalSerbiaSeychellesSierra LeoneSingaporeSlovak RepublicSloveniaSmall statesSolomon IslandsSouth AfricaSouth AsiaSouth Asia (IDA & IBRD)South SudanSpainSri LankaSt. Kitts and NevisSt. LuciaSt. Vincent and the GrenadinesSub-Saharan Africa Sub-Saharan Africa (excluding high income)Sub-Saharan Africa (IDA & IBRD countries)SudanSurinameSwazilandSwedenSwitzerlandTajikistanTanzaniaThailandTimor-LesteTogoTongaTrinidad and TobagoTunisiaTurkeyTurkmenistanTuvaluUgandaUkraineUnited Arab EmiratesUnited KingdomUnited StatesUpper middle incomeUruguayUzbekistanVanuatuVenezuela, RBVietnamWest Bank and GazaWorldYemen, Rep.ZambiaZimbabwe Timeline:
This timeline shows a graph from 1961 to 2015 of Algeria. No data until 1960. Number of actual observations by date: 55.
Source name:
World Development Indicators
Source organization:
World Bank national accounts data, and OECD National Accounts data files.
Categories, topics:
Economy & Growth
Last updated:
apr 23, 2017
Indicators value changes by year
Minimum:
1.737K
jan 1, 1963
Maximum:
4.605K
jan 1, 2015
At the date of observation
Value
Absolute change
Change from previous value
jan 1, 1961
2.652K
+2.652K
0.0%
jan 1, 1962
2.218K
-433.644
-16.35%
jan 1, 1963
1.737K
-480.937
-21.68%
jan 1, 1964
2.163K
+425.963
24.52%
jan 1, 1965
2.201K
+38.455
1.78%
jan 1, 1966
2.24K
+38.662
1.76%
jan 1, 1967
2.06K
-179.792
-8.03%
jan 1, 1968
2.211K
+150.967
7.33%
jan 1, 1969
2.393K
+181.557
8.21%
jan 1, 1970
2.544K
+151.205
6.32%
jan 1, 1971
2.653K
+108.869
4.28%
jan 1, 1972
2.309K
-343.62
-12.95%
jan 1, 1973
2.872K
+562.941
24.38%
jan 1, 1974
2.89K
+18.201
0.63%
jan 1, 1975
3.026K
+135.253
4.68%
jan 1, 1976
3.076K
+50.509
1.67%
jan 1, 1977
3.223K
+146.859
4.77%
jan 1, 1978
3.297K
+74.085
2.3%
jan 1, 1979
3.485K
+187.799
5.7%
jan 1, 1980
3.596K
+111.288
3.19%
jan 1, 1981
3.519K
-77.291
-2.15%
jan 1, 1982
3.51K
-9.205
-0.26%
jan 1, 1983
3.623K
+113.091
3.22%
jan 1, 1984
3.716K
+92.89
2.56%
jan 1, 1985
3.8K
+84.561
2.28%
jan 1, 1986
3.825K
+25.11
0.66%
jan 1, 1987
3.756K
-69.012
-1.8%
jan 1, 1988
3.626K
-129.849
-3.46%
jan 1, 1989
3.464K
-162.975
-4.49%
jan 1, 1990
3.522K
+58.492
1.69%
jan 1, 1991
3.458K
-64.423
-1.83%
jan 1, 1992
3.29K
-167.615
-4.85%
jan 1, 1993
3.287K
-2.581
-0.08%
jan 1, 1994
3.176K
-110.945
-3.37%
jan 1, 1995
3.07K
-106.489
-3.35%
jan 1, 1996
3.1K
+30.196
0.98%
jan 1, 1997
3.162K
+61.819
1.99%
jan 1, 1998
3.165K
+3.474
0.11%
jan 1, 1999
3.297K
+132.03
4.17%
jan 1, 2000
3.34K
+42.87
1.3%
jan 1, 2001
3.392K
+51.447
1.54%
jan 1, 2002
3.513K
+121.346
3.58%
jan 1, 2003
3.638K
+124.402
3.54%
jan 1, 2004
3.854K
+216.068
5.94%
jan 1, 2005
3.948K
+94.202
2.44%
jan 1, 2006
4.093K
+144.826
3.67%
jan 1, 2007
4.12K
+27.013
0.66%
jan 1, 2008
4.308K
+188.089
4.57%
jan 1, 2009
4.367K
+59.145
1.37%
jan 1, 2010
4.363K
-3.791
-0.09%
jan 1, 2011
4.468K
+104.546
2.4%
jan 1, 2012
4.477K
+9.695
0.22%
jan 1, 2013
4.532K
+54.533
1.22%
jan 1, 2014
4.535K
+3.328
0.07%
jan 1, 2015
4.605K
+69.375
1.53%
Ranking of countries by current statistics by years


Comments: