29
/
en
AIzaSyAYiBZKx7MnpbEhh9jyipgxe19OcubqV5w
April 1, 2024
154622
India
IND
true
2
1
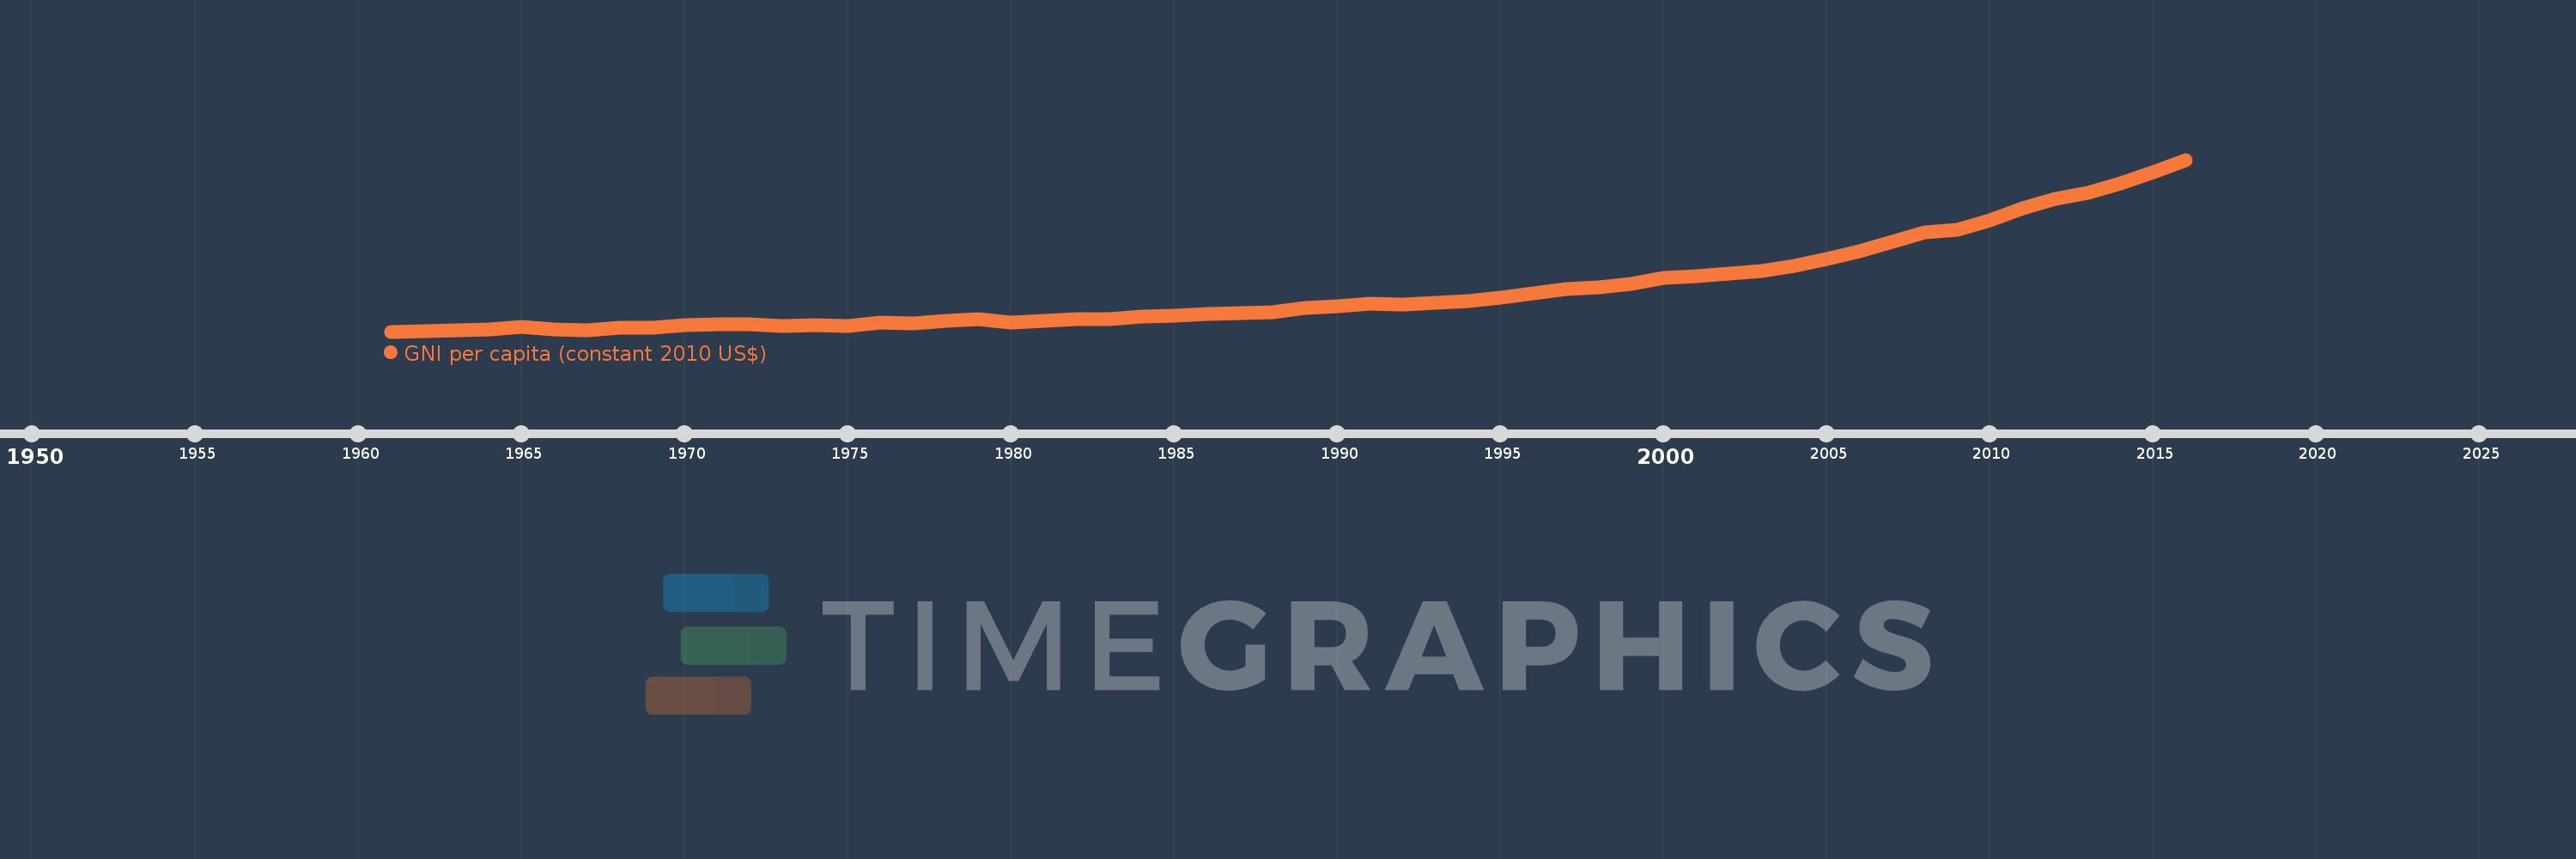
GNI per capita (constant 2010 US$)
2016,2015,2014,2013,2012,2011,2010,2009,2008,2007,2006,2005,2004,2003,2002,2001,2000,1999,1998,1997,1996,1995,1994,1993,1992,1991,1990,1989,1988,1987,1986,1985,1984,1983,1982,1981,1980,1979,1978,1977,1976,1975,1974,1973,1972,1971,1970,1969,1968,1967,1966,1965,1964,1963,1962,1961
This statistics in other country:
AfghanistanAlbaniaAlgeriaAndorraAngolaAntigua and BarbudaArab WorldArgentinaArmeniaAustraliaAustriaAzerbaijanBahamas, TheBahrainBangladeshBarbadosBelarusBelgiumBelizeBeninBermudaBhutanBoliviaBosnia and HerzegovinaBotswanaBrazilBrunei DarussalamBulgariaBurkina FasoBurundiCabo VerdeCambodiaCameroonCanadaCaribbean small statesCentral African RepublicCentral Europe and the BalticsChadChileChinaColombiaComorosCongo, Dem. Rep.Congo, Rep.Costa RicaCote d'IvoireCroatiaCubaCyprusCzech RepublicDenmarkDominicaDominican RepublicEarly-demographic dividendEast Asia & PacificEast Asia & Pacific (excluding high income)East Asia & Pacific (IDA & IBRD countries)EcuadorEgypt, Arab Rep.El SalvadorEquatorial GuineaEritreaEstoniaEthiopiaEuro areaEurope & Central AsiaEurope & Central Asia (excluding high income)Europe & Central Asia (IDA & IBRD countries)European UnionFaroe IslandsFijiFinlandFragile and conflict affected situationsFranceGabonGambia, TheGeorgiaGermanyGhanaGreeceGrenadaGuatemalaGuineaGuinea-BissauGuyanaHaitiHeavily indebted poor countries (HIPC)High incomeHondurasHong Kong SAR, ChinaHungaryIBRD onlyIcelandIDA & IBRD totalIDA blendIDA onlyIDA totalIndiaIndonesiaIran, Islamic Rep.IraqIrelandIsle of ManIsraelItalyJamaicaJapanJordanKazakhstanKenyaKiribatiKorea, Rep.KosovoKuwaitKyrgyz RepublicLao PDRLate-demographic dividendLatin America & Caribbean Latin America & Caribbean (excluding high income)Latin America & the Caribbean (IDA & IBRD countries)LatviaLeast developed countries: UN classificationLebanonLesothoLiberiaLibyaLiechtensteinLithuaniaLow & middle incomeLow incomeLower middle incomeLuxembourgMacao SAR, ChinaMacedonia, FYRMadagascarMalawiMalaysiaMaldivesMaliMaltaMarshall IslandsMauritaniaMauritiusMexicoMicronesia, Fed. Sts.Middle East & North AfricaMiddle East & North Africa (excluding high income)Middle East & North Africa (IDA & IBRD countries)Middle incomeMoldovaMongoliaMontenegroMoroccoMozambiqueMyanmarNamibiaNauruNepalNetherlandsNew ZealandNicaraguaNigerNigeriaNorth AmericaNorwayOECD membersOmanOther small statesPacific island small statesPakistanPalauPanamaPapua New GuineaParaguayPeruPhilippinesPolandPortugalPost-demographic dividendPre-demographic dividendPuerto RicoQatarRomaniaRussian FederationRwandaSamoaSao Tome and PrincipeSaudi ArabiaSenegalSerbiaSeychellesSierra LeoneSingaporeSlovak RepublicSloveniaSmall statesSolomon IslandsSouth AfricaSouth AsiaSouth Asia (IDA & IBRD)South SudanSpainSri LankaSt. Kitts and NevisSt. LuciaSt. Vincent and the GrenadinesSub-Saharan Africa Sub-Saharan Africa (excluding high income)Sub-Saharan Africa (IDA & IBRD countries)SudanSurinameSwazilandSwedenSwitzerlandTajikistanTanzaniaThailandTimor-LesteTogoTongaTrinidad and TobagoTunisiaTurkeyTurkmenistanTuvaluUgandaUkraineUnited Arab EmiratesUnited KingdomUnited StatesUpper middle incomeUruguayUzbekistanVanuatuVenezuela, RBVietnamWest Bank and GazaWorldYemen, Rep.ZambiaZimbabwe Timeline:
This timeline shows a graph from 1961 to 2016 of India. No data until 1960. Number of actual observations by date: 56.
Source name:
World Development Indicators
Source organization:
World Bank national accounts data, and OECD National Accounts data files.
Categories, topics:
Economy & Growth
Last updated:
apr 23, 2017
Indicators value changes by year
Minimum:
306.207
jan 1, 1961
Maximum:
1.731K
jan 1, 2016
At the date of observation
Value
Absolute change
Change from previous value
jan 1, 1961
306.207
+306.207
0.0%
jan 1, 1962
310.996
+4.789
1.56%
jan 1, 1963
313.667
+2.671
0.86%
jan 1, 1964
325.904
+12.238
3.9%
jan 1, 1965
342.86
+16.956
5.2%
jan 1, 1966
326.839
-16.022
-4.67%
jan 1, 1967
319.481
-7.357
-2.25%
jan 1, 1968
337.447
+17.966
5.62%
jan 1, 1969
341.725
+4.278
1.27%
jan 1, 1970
356.379
+14.654
4.29%
jan 1, 1971
366.619
+10.24
2.87%
jan 1, 1972
364.397
-2.222
-0.61%
jan 1, 1973
354.25
-10.147
-2.78%
jan 1, 1974
357.743
+3.494
0.99%
jan 1, 1975
354.076
-3.668
-1.03%
jan 1, 1976
377.863
+23.788
6.72%
jan 1, 1977
375.564
-2.299
-0.61%
jan 1, 1978
393.803
+18.239
4.86%
jan 1, 1979
407.25
+13.447
3.41%
jan 1, 1980
378.141
-29.109
-7.15%
jan 1, 1981
394.835
+16.694
4.41%
jan 1, 1982
408.149
+13.314
3.37%
jan 1, 1983
411.252
+3.103
0.76%
jan 1, 1984
430.739
+19.487
4.74%
jan 1, 1985
436.484
+5.745
1.33%
jan 1, 1986
449.452
+12.968
2.97%
jan 1, 1987
460.274
+10.822
2.41%
jan 1, 1988
467.491
+7.217
1.57%
jan 1, 1989
500.018
+32.527
6.96%
jan 1, 1990
518.131
+18.113
3.62%
jan 1, 1991
534.847
+16.715
3.23%
jan 1, 1992
528.438
-6.409
-1.2%
jan 1, 1993
546.298
+17.86
3.38%
jan 1, 1994
561.849
+15.551
2.85%
jan 1, 1995
588.321
+26.472
4.71%
jan 1, 1996
621.872
+33.551
5.7%
jan 1, 1997
657.5
+35.628
5.73%
jan 1, 1998
671.894
+14.395
2.19%
jan 1, 1999
700.436
+28.542
4.25%
jan 1, 2000
749.31
+48.874
6.98%
jan 1, 2001
762.264
+12.955
1.73%
jan 1, 2002
786.862
+24.597
3.23%
jan 1, 2003
804.718
+17.856
2.27%
jan 1, 2004
853.075
+48.357
6.01%
jan 1, 2005
906.365
+53.29
6.25%
jan 1, 2006
974.843
+68.478
7.56%
jan 1, 2007
1.048K
+73.332
7.52%
jan 1, 2008
1.125K
+77.161
7.36%
jan 1, 2009
1.15K
+24.684
2.19%
jan 1, 2010
1.23K
+79.934
6.95%
jan 1, 2011
1.331K
+101.181
8.23%
jan 1, 2012
1.404K
+72.563
5.45%
jan 1, 2013
1.459K
+55.639
3.96%
jan 1, 2014
1.536K
+76.647
5.25%
jan 1, 2015
1.628K
+92.218
6.0%
jan 1, 2016
1.731K
+102.303
6.28%
Ranking of countries by current statistics by years


Comments: