29
/
en
AIzaSyAYiBZKx7MnpbEhh9jyipgxe19OcubqV5w
April 1, 2024
185198
Madagascar
MDG
true
2
1
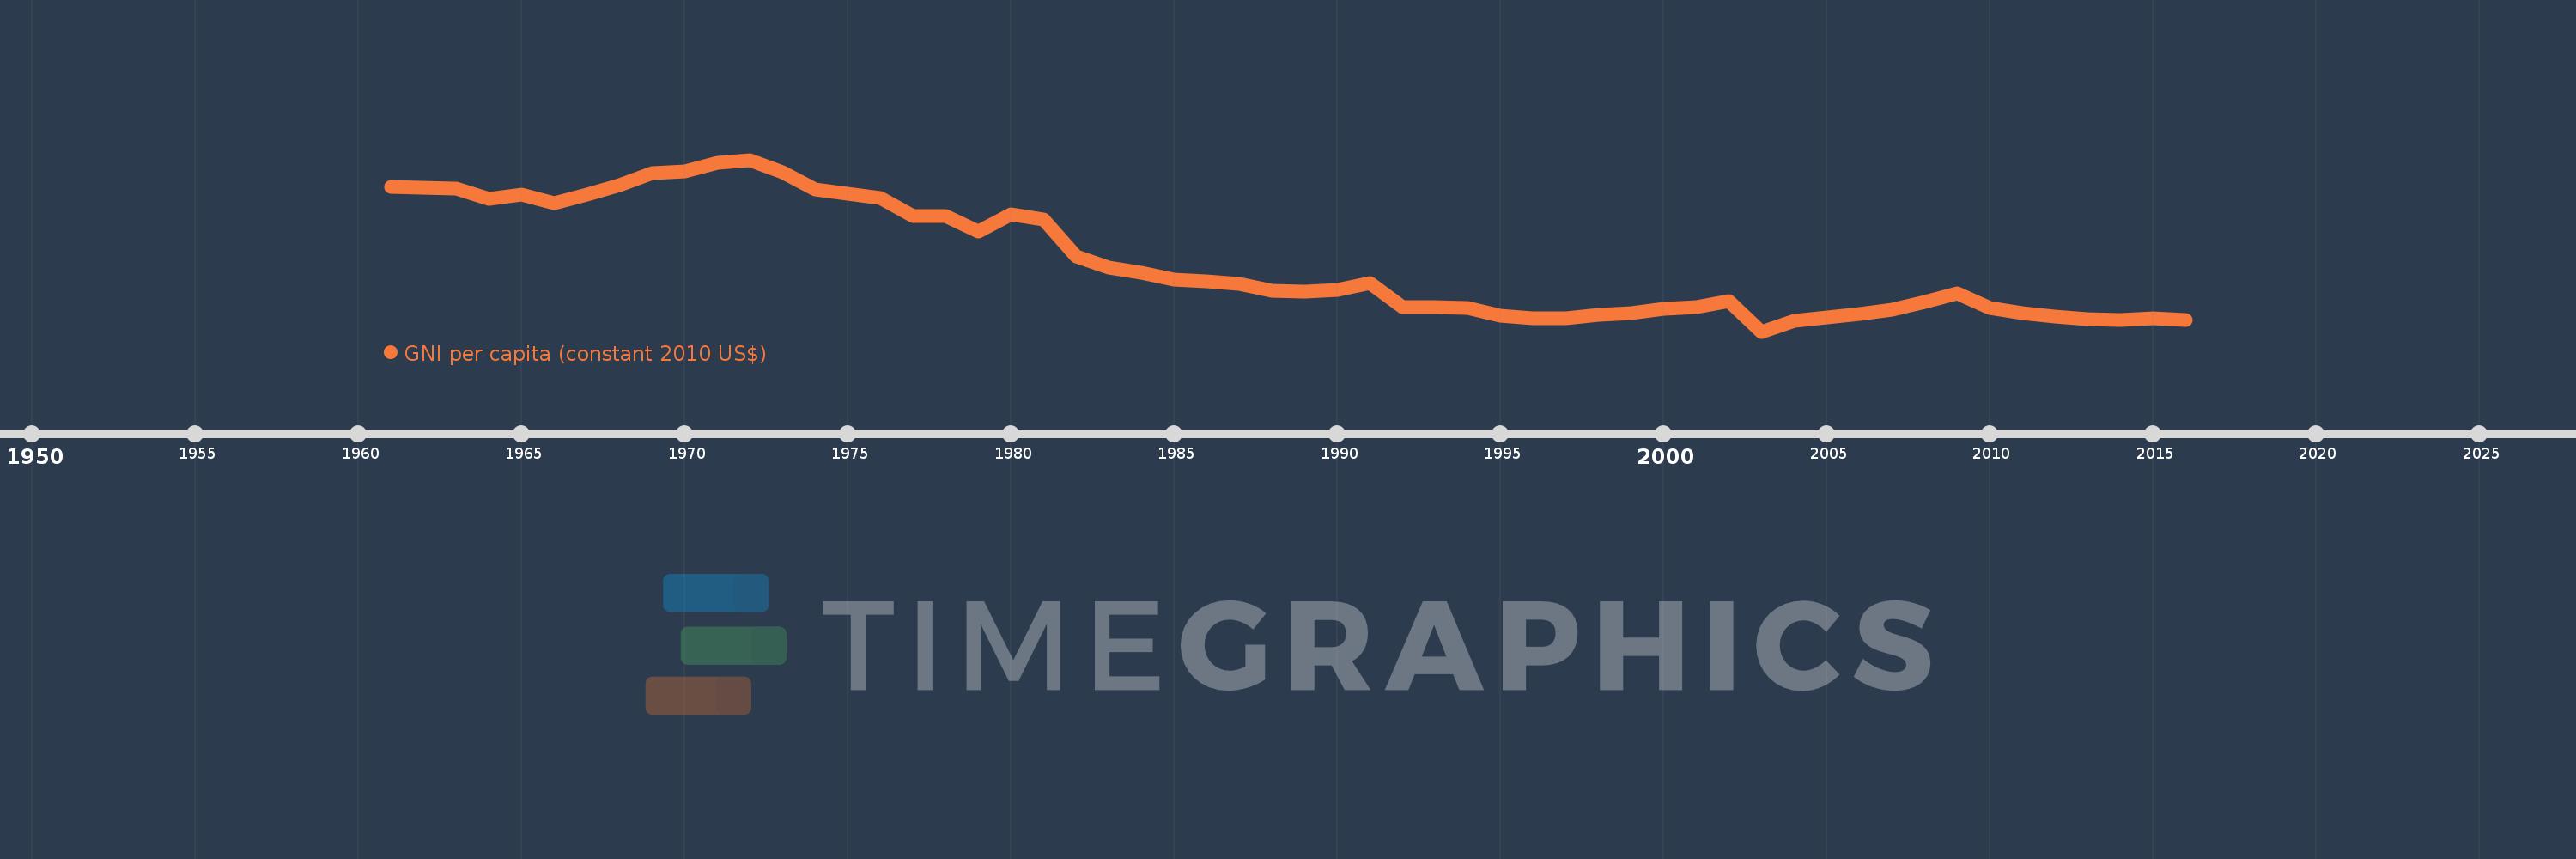
GNI per capita (constant 2010 US$)
2016,2015,2014,2013,2012,2011,2010,2009,2008,2007,2006,2005,2004,2003,2002,2001,2000,1999,1998,1997,1996,1995,1994,1993,1992,1991,1990,1989,1988,1987,1986,1985,1984,1983,1982,1981,1980,1979,1978,1977,1976,1975,1974,1973,1972,1971,1970,1969,1968,1967,1966,1965,1964,1963,1962,1961
This statistics in other country:
AfghanistanAlbaniaAlgeriaAndorraAngolaAntigua and BarbudaArab WorldArgentinaArmeniaAustraliaAustriaAzerbaijanBahamas, TheBahrainBangladeshBarbadosBelarusBelgiumBelizeBeninBermudaBhutanBoliviaBosnia and HerzegovinaBotswanaBrazilBrunei DarussalamBulgariaBurkina FasoBurundiCabo VerdeCambodiaCameroonCanadaCaribbean small statesCentral African RepublicCentral Europe and the BalticsChadChileChinaColombiaComorosCongo, Dem. Rep.Congo, Rep.Costa RicaCote d'IvoireCroatiaCubaCyprusCzech RepublicDenmarkDominicaDominican RepublicEarly-demographic dividendEast Asia & PacificEast Asia & Pacific (excluding high income)East Asia & Pacific (IDA & IBRD countries)EcuadorEgypt, Arab Rep.El SalvadorEquatorial GuineaEritreaEstoniaEthiopiaEuro areaEurope & Central AsiaEurope & Central Asia (excluding high income)Europe & Central Asia (IDA & IBRD countries)European UnionFaroe IslandsFijiFinlandFragile and conflict affected situationsFranceGabonGambia, TheGeorgiaGermanyGhanaGreeceGrenadaGuatemalaGuineaGuinea-BissauGuyanaHaitiHeavily indebted poor countries (HIPC)High incomeHondurasHong Kong SAR, ChinaHungaryIBRD onlyIcelandIDA & IBRD totalIDA blendIDA onlyIDA totalIndiaIndonesiaIran, Islamic Rep.IraqIrelandIsle of ManIsraelItalyJamaicaJapanJordanKazakhstanKenyaKiribatiKorea, Rep.KosovoKuwaitKyrgyz RepublicLao PDRLate-demographic dividendLatin America & Caribbean Latin America & Caribbean (excluding high income)Latin America & the Caribbean (IDA & IBRD countries)LatviaLeast developed countries: UN classificationLebanonLesothoLiberiaLibyaLiechtensteinLithuaniaLow & middle incomeLow incomeLower middle incomeLuxembourgMacao SAR, ChinaMacedonia, FYRMadagascarMalawiMalaysiaMaldivesMaliMaltaMarshall IslandsMauritaniaMauritiusMexicoMicronesia, Fed. Sts.Middle East & North AfricaMiddle East & North Africa (excluding high income)Middle East & North Africa (IDA & IBRD countries)Middle incomeMoldovaMongoliaMontenegroMoroccoMozambiqueMyanmarNamibiaNauruNepalNetherlandsNew ZealandNicaraguaNigerNigeriaNorth AmericaNorwayOECD membersOmanOther small statesPacific island small statesPakistanPalauPanamaPapua New GuineaParaguayPeruPhilippinesPolandPortugalPost-demographic dividendPre-demographic dividendPuerto RicoQatarRomaniaRussian FederationRwandaSamoaSao Tome and PrincipeSaudi ArabiaSenegalSerbiaSeychellesSierra LeoneSingaporeSlovak RepublicSloveniaSmall statesSolomon IslandsSouth AfricaSouth AsiaSouth Asia (IDA & IBRD)South SudanSpainSri LankaSt. Kitts and NevisSt. LuciaSt. Vincent and the GrenadinesSub-Saharan Africa Sub-Saharan Africa (excluding high income)Sub-Saharan Africa (IDA & IBRD countries)SudanSurinameSwazilandSwedenSwitzerlandTajikistanTanzaniaThailandTimor-LesteTogoTongaTrinidad and TobagoTunisiaTurkeyTurkmenistanTuvaluUgandaUkraineUnited Arab EmiratesUnited KingdomUnited StatesUpper middle incomeUruguayUzbekistanVanuatuVenezuela, RBVietnamWest Bank and GazaWorldYemen, Rep.ZambiaZimbabwe Timeline:
This timeline shows a graph from 1961 to 2016 of Madagascar. No data until 1960. Number of actual observations by date: 56.
Source name:
World Development Indicators
Source organization:
World Bank national accounts data, and OECD National Accounts data files.
Categories, topics:
Economy & Growth
Last updated:
apr 23, 2017
Indicators value changes by year
Minimum:
368.83
jan 1, 2003
Maximum:
749.697
jan 1, 1972
At the date of observation
Value
Absolute change
Change from previous value
jan 1, 1961
689.974
+689.974
0.0%
jan 1, 1962
687.767
-2.208
-0.32%
jan 1, 1963
686.075
-1.692
-0.25%
jan 1, 1964
662.688
-23.386
-3.41%
jan 1, 1965
672.26
+9.571
1.44%
jan 1, 1966
652.683
-19.577
-2.91%
jan 1, 1967
673.497
+20.814
3.19%
jan 1, 1968
692.68
+19.184
2.85%
jan 1, 1969
720.935
+28.255
4.08%
jan 1, 1970
724.401
+3.466
0.48%
jan 1, 1971
743.848
+19.447
2.68%
jan 1, 1972
749.697
+5.849
0.79%
jan 1, 1973
722.86
-26.837
-3.58%
jan 1, 1974
683.216
-39.644
-5.48%
jan 1, 1975
674.167
-9.05
-1.32%
jan 1, 1976
664.599
-9.568
-1.42%
jan 1, 1977
625.704
-38.895
-5.85%
jan 1, 1978
625.253
-0.451
-0.07%
jan 1, 1979
591.277
-33.976
-5.43%
jan 1, 1980
629.269
+37.992
6.43%
jan 1, 1981
616.446
-12.823
-2.04%
jan 1, 1982
536.088
-80.358
-13.04%
jan 1, 1983
510.852
-25.236
-4.71%
jan 1, 1984
499.164
-11.687
-2.29%
jan 1, 1985
484.525
-14.639
-2.93%
jan 1, 1986
480.192
-4.333
-0.89%
jan 1, 1987
473.925
-6.267
-1.31%
jan 1, 1988
459.421
-14.504
-3.06%
jan 1, 1989
456.952
-2.469
-0.54%
jan 1, 1990
460.26
+3.308
0.72%
jan 1, 1991
475.894
+15.634
3.4%
jan 1, 1992
423.366
-52.528
-11.04%
jan 1, 1993
423.131
-0.235
-0.06%
jan 1, 1994
420.883
-2.249
-0.53%
jan 1, 1995
404.042
-16.841
-4.0%
jan 1, 1996
398.075
-5.966
-1.48%
jan 1, 1997
397.783
-0.292
-0.07%
jan 1, 1998
405.028
+7.245
1.82%
jan 1, 1999
410.056
+5.028
1.24%
jan 1, 2000
419.355
+9.299
2.27%
jan 1, 2001
423.004
+3.649
0.87%
jan 1, 2002
436.785
+13.781
3.26%
jan 1, 2003
368.83
-67.955
-15.56%
jan 1, 2004
393.493
+24.663
6.69%
jan 1, 2005
400.963
+7.47
1.9%
jan 1, 2006
408.613
+7.65
1.91%
jan 1, 2007
417.447
+8.834
2.16%
jan 1, 2008
433.905
+16.458
3.94%
jan 1, 2009
452.812
+18.908
4.36%
jan 1, 2010
420.563
-32.249
-7.12%
jan 1, 2011
409.729
-10.834
-2.58%
jan 1, 2012
402.148
-7.581
-1.85%
jan 1, 2013
396.479
-5.669
-1.41%
jan 1, 2014
394.468
-2.011
-0.51%
jan 1, 2015
397.779
+3.311
0.84%
jan 1, 2016
394.752
-3.026
-0.76%
Ranking of countries by current statistics by years


Comments: