29
/
en
AIzaSyAYiBZKx7MnpbEhh9jyipgxe19OcubqV5w
April 1, 2024
231064
Rwanda
RWA
true
2
1
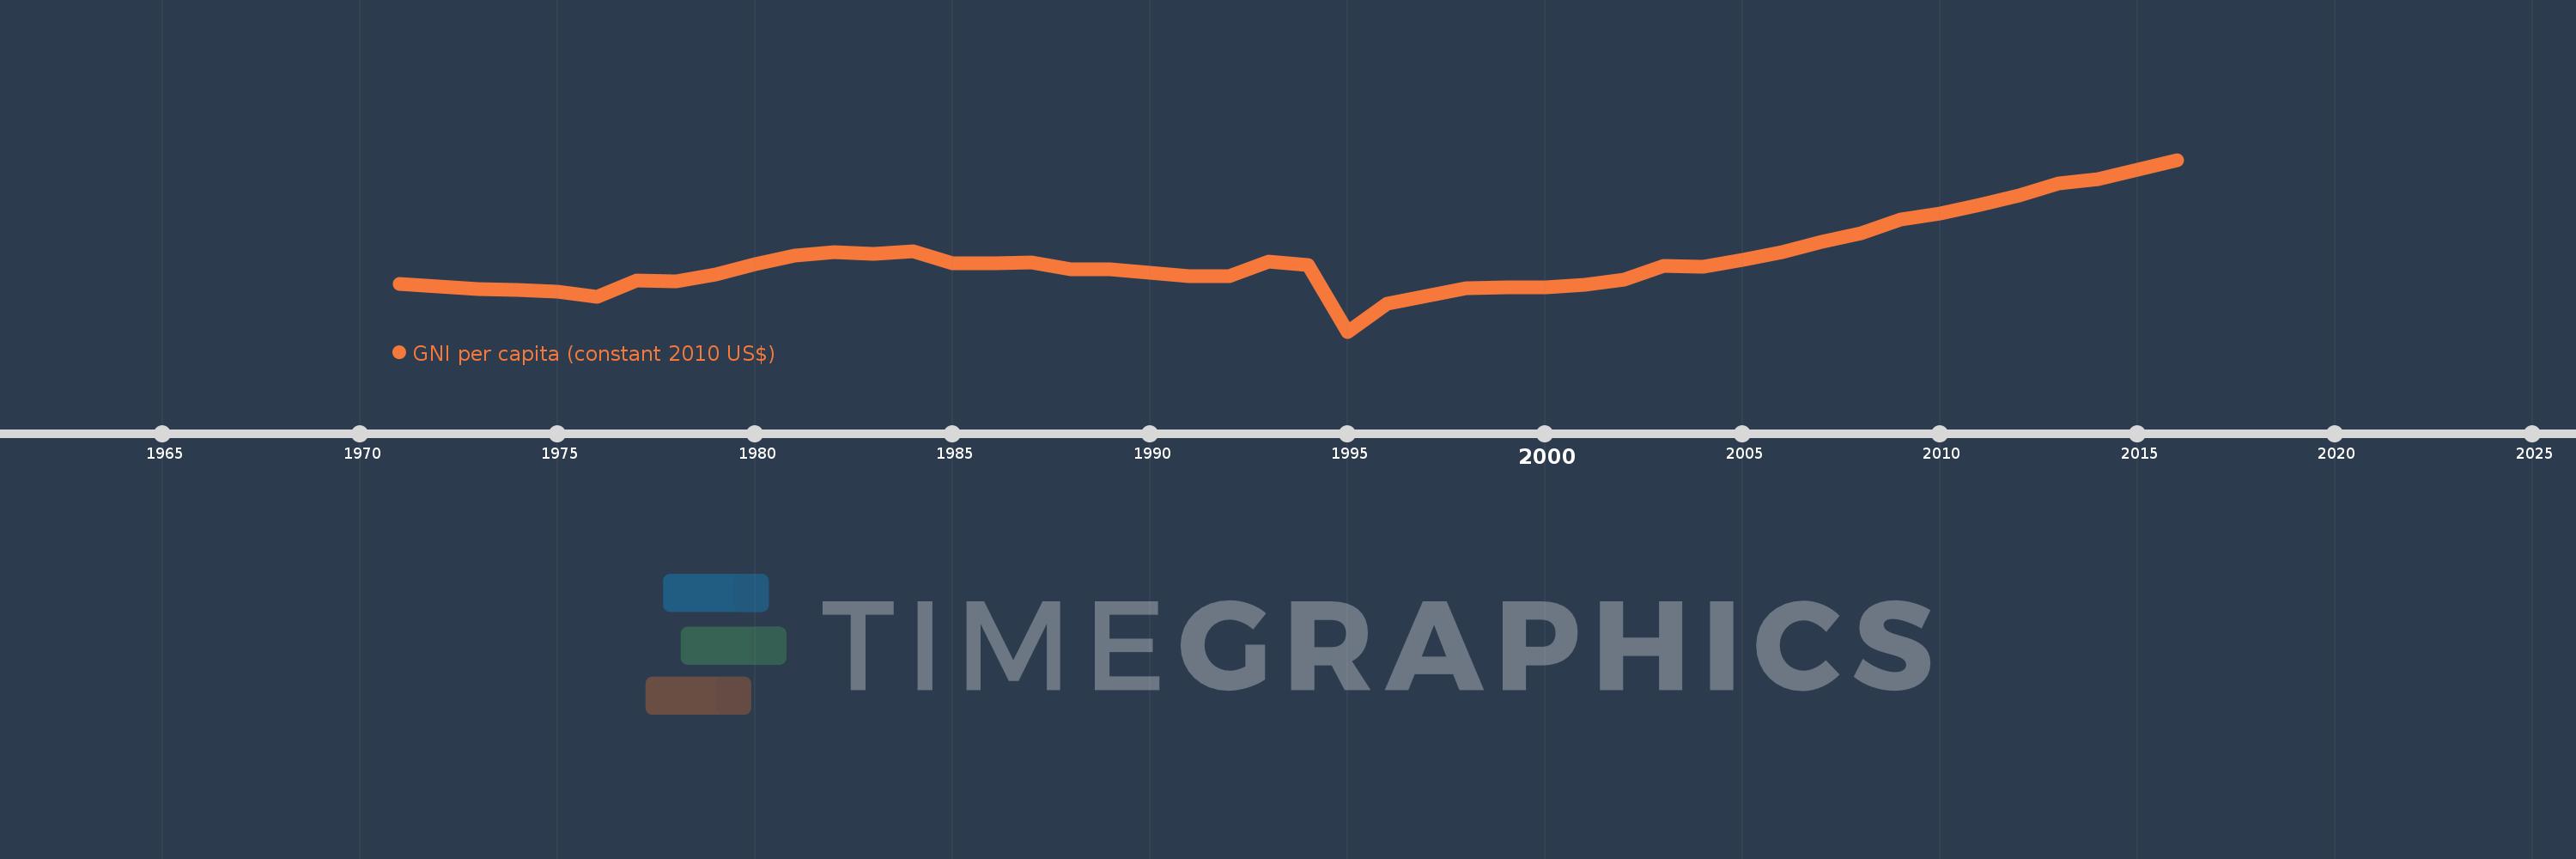
GNI per capita (constant 2010 US$)
2016,2015,2014,2013,2012,2011,2010,2009,2008,2007,2006,2005,2004,2003,2002,2001,2000,1999,1998,1997,1996,1995,1994,1993,1992,1991,1990,1989,1988,1987,1986,1985,1984,1983,1982,1981,1980,1979,1978,1977,1976,1975,1974,1973,1972,1971
This statistics in other country:
AfghanistanAlbaniaAlgeriaAndorraAngolaAntigua and BarbudaArab WorldArgentinaArmeniaAustraliaAustriaAzerbaijanBahamas, TheBahrainBangladeshBarbadosBelarusBelgiumBelizeBeninBermudaBhutanBoliviaBosnia and HerzegovinaBotswanaBrazilBrunei DarussalamBulgariaBurkina FasoBurundiCabo VerdeCambodiaCameroonCanadaCaribbean small statesCentral African RepublicCentral Europe and the BalticsChadChileChinaColombiaComorosCongo, Dem. Rep.Congo, Rep.Costa RicaCote d'IvoireCroatiaCubaCyprusCzech RepublicDenmarkDominicaDominican RepublicEarly-demographic dividendEast Asia & PacificEast Asia & Pacific (excluding high income)East Asia & Pacific (IDA & IBRD countries)EcuadorEgypt, Arab Rep.El SalvadorEquatorial GuineaEritreaEstoniaEthiopiaEuro areaEurope & Central AsiaEurope & Central Asia (excluding high income)Europe & Central Asia (IDA & IBRD countries)European UnionFaroe IslandsFijiFinlandFragile and conflict affected situationsFranceGabonGambia, TheGeorgiaGermanyGhanaGreeceGrenadaGuatemalaGuineaGuinea-BissauGuyanaHaitiHeavily indebted poor countries (HIPC)High incomeHondurasHong Kong SAR, ChinaHungaryIBRD onlyIcelandIDA & IBRD totalIDA blendIDA onlyIDA totalIndiaIndonesiaIran, Islamic Rep.IraqIrelandIsle of ManIsraelItalyJamaicaJapanJordanKazakhstanKenyaKiribatiKorea, Rep.KosovoKuwaitKyrgyz RepublicLao PDRLate-demographic dividendLatin America & Caribbean Latin America & Caribbean (excluding high income)Latin America & the Caribbean (IDA & IBRD countries)LatviaLeast developed countries: UN classificationLebanonLesothoLiberiaLibyaLiechtensteinLithuaniaLow & middle incomeLow incomeLower middle incomeLuxembourgMacao SAR, ChinaMacedonia, FYRMadagascarMalawiMalaysiaMaldivesMaliMaltaMarshall IslandsMauritaniaMauritiusMexicoMicronesia, Fed. Sts.Middle East & North AfricaMiddle East & North Africa (excluding high income)Middle East & North Africa (IDA & IBRD countries)Middle incomeMoldovaMongoliaMontenegroMoroccoMozambiqueMyanmarNamibiaNauruNepalNetherlandsNew ZealandNicaraguaNigerNigeriaNorth AmericaNorwayOECD membersOmanOther small statesPacific island small statesPakistanPalauPanamaPapua New GuineaParaguayPeruPhilippinesPolandPortugalPost-demographic dividendPre-demographic dividendPuerto RicoQatarRomaniaRussian FederationRwandaSamoaSao Tome and PrincipeSaudi ArabiaSenegalSerbiaSeychellesSierra LeoneSingaporeSlovak RepublicSloveniaSmall statesSolomon IslandsSouth AfricaSouth AsiaSouth Asia (IDA & IBRD)South SudanSpainSri LankaSt. Kitts and NevisSt. LuciaSt. Vincent and the GrenadinesSub-Saharan Africa Sub-Saharan Africa (excluding high income)Sub-Saharan Africa (IDA & IBRD countries)SudanSurinameSwazilandSwedenSwitzerlandTajikistanTanzaniaThailandTimor-LesteTogoTongaTrinidad and TobagoTunisiaTurkeyTurkmenistanTuvaluUgandaUkraineUnited Arab EmiratesUnited KingdomUnited StatesUpper middle incomeUruguayUzbekistanVanuatuVenezuela, RBVietnamWest Bank and GazaWorldYemen, Rep.ZambiaZimbabwe Timeline:
This timeline shows a graph from 1971 to 2016 of Rwanda. No data until 1970. Number of actual observations by date: 46.
Source name:
World Development Indicators
Source organization:
World Bank national accounts data, and OECD National Accounts data files.
Categories, topics:
Economy & Growth
Last updated:
apr 23, 2017
Indicators value changes by year
Minimum:
201.499
jan 1, 1995
Maximum:
673.826
jan 1, 2016
At the date of observation
Value
Absolute change
Change from previous value
jan 1, 1971
331.749
+331.749
0.0%
jan 1, 1972
325.736
-6.013
-1.81%
jan 1, 1973
317.254
-8.482
-2.6%
jan 1, 1974
315.881
-1.373
-0.43%
jan 1, 1975
310.944
-4.936
-1.56%
jan 1, 1976
296.034
-14.91
-4.8%
jan 1, 1977
342.77
+46.736
15.79%
jan 1, 1978
338.533
-4.237
-1.24%
jan 1, 1979
357.579
+19.046
5.63%
jan 1, 1980
387.691
+30.111
8.42%
jan 1, 1981
409.696
+22.005
5.68%
jan 1, 1982
419.715
+10.019
2.45%
jan 1, 1983
414.43
-5.285
-1.26%
jan 1, 1984
423.178
+8.748
2.11%
jan 1, 1985
390.141
-33.037
-7.81%
jan 1, 1986
389.303
-0.839
-0.21%
jan 1, 1987
391.634
+2.331
0.6%
jan 1, 1988
372.018
-19.615
-5.01%
jan 1, 1989
372.116
+0.097
0.03%
jan 1, 1990
362.72
-9.396
-2.52%
jan 1, 1991
352.811
-9.909
-2.73%
jan 1, 1992
352.661
-0.15
-0.04%
jan 1, 1993
393.587
+40.927
11.61%
jan 1, 1994
384.335
-9.253
-2.35%
jan 1, 1995
201.499
-182.836
-47.57%
jan 1, 1996
278.673
+77.175
38.3%
jan 1, 1997
300.599
+21.925
7.87%
jan 1, 1998
320.975
+20.376
6.78%
jan 1, 1999
322.317
+1.342
0.42%
jan 1, 2000
323.327
+1.01
0.31%
jan 1, 2001
330.208
+6.881
2.13%
jan 1, 2002
344.054
+13.847
4.19%
jan 1, 2003
381.889
+37.835
11.0%
jan 1, 2004
379.09
-2.799
-0.73%
jan 1, 2005
398.96
+19.87
5.24%
jan 1, 2006
420.228
+21.268
5.33%
jan 1, 2007
448.343
+28.115
6.69%
jan 1, 2008
471.997
+23.654
5.28%
jan 1, 2009
508.876
+36.879
7.81%
jan 1, 2010
525.967
+17.091
3.36%
jan 1, 2011
549.433
+23.465
4.46%
jan 1, 2012
576.995
+27.562
5.02%
jan 1, 2013
609.8
+32.806
5.69%
jan 1, 2014
620.19
+10.389
1.7%
jan 1, 2015
647.109
+26.919
4.34%
jan 1, 2016
673.826
+26.717
4.13%
Ranking of countries by current statistics by years


Comments: