29
/
en
AIzaSyAYiBZKx7MnpbEhh9jyipgxe19OcubqV5w
April 1, 2024
47145
Lower middle income
LMC
false
2
1
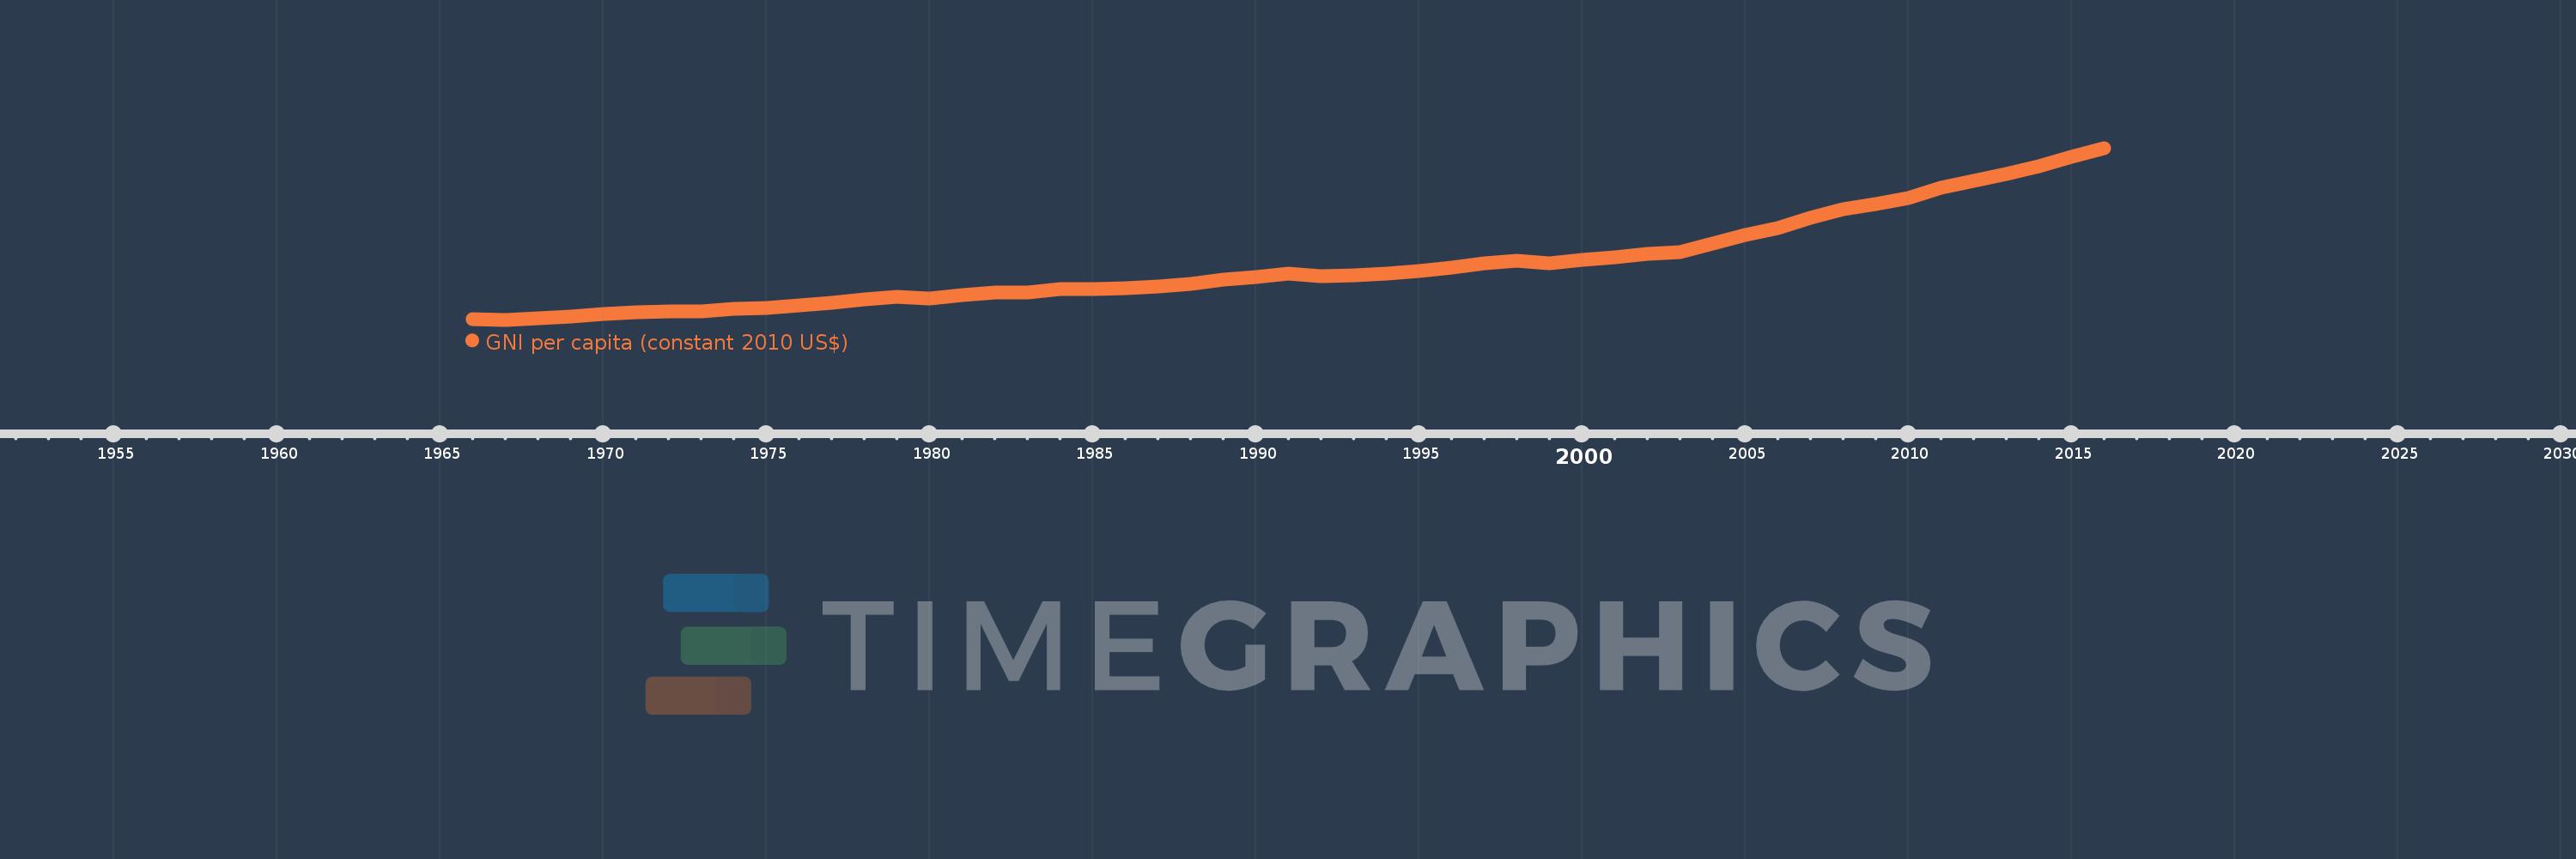
GNI per capita (constant 2010 US$)
2016,2015,2014,2013,2012,2011,2010,2009,2008,2007,2006,2005,2004,2003,2002,2001,2000,1999,1998,1997,1996,1995,1994,1993,1992,1991,1990,1989,1988,1987,1986,1985,1984,1983,1982,1981,1980,1979,1978,1977,1976,1975,1974,1973,1972,1971,1970,1969,1968,1967,1966
This statistics in other country:
AfghanistanAlbaniaAlgeriaAndorraAngolaAntigua and BarbudaArab WorldArgentinaArmeniaAustraliaAustriaAzerbaijanBahamas, TheBahrainBangladeshBarbadosBelarusBelgiumBelizeBeninBermudaBhutanBoliviaBosnia and HerzegovinaBotswanaBrazilBrunei DarussalamBulgariaBurkina FasoBurundiCabo VerdeCambodiaCameroonCanadaCaribbean small statesCentral African RepublicCentral Europe and the BalticsChadChileChinaColombiaComorosCongo, Dem. Rep.Congo, Rep.Costa RicaCote d'IvoireCroatiaCubaCyprusCzech RepublicDenmarkDominicaDominican RepublicEarly-demographic dividendEast Asia & PacificEast Asia & Pacific (excluding high income)East Asia & Pacific (IDA & IBRD countries)EcuadorEgypt, Arab Rep.El SalvadorEquatorial GuineaEritreaEstoniaEthiopiaEuro areaEurope & Central AsiaEurope & Central Asia (excluding high income)Europe & Central Asia (IDA & IBRD countries)European UnionFaroe IslandsFijiFinlandFragile and conflict affected situationsFranceGabonGambia, TheGeorgiaGermanyGhanaGreeceGrenadaGuatemalaGuineaGuinea-BissauGuyanaHaitiHeavily indebted poor countries (HIPC)High incomeHondurasHong Kong SAR, ChinaHungaryIBRD onlyIcelandIDA & IBRD totalIDA blendIDA onlyIDA totalIndiaIndonesiaIran, Islamic Rep.IraqIrelandIsle of ManIsraelItalyJamaicaJapanJordanKazakhstanKenyaKiribatiKorea, Rep.KosovoKuwaitKyrgyz RepublicLao PDRLate-demographic dividendLatin America & Caribbean Latin America & Caribbean (excluding high income)Latin America & the Caribbean (IDA & IBRD countries)LatviaLeast developed countries: UN classificationLebanonLesothoLiberiaLibyaLiechtensteinLithuaniaLow & middle incomeLow incomeLower middle incomeLuxembourgMacao SAR, ChinaMacedonia, FYRMadagascarMalawiMalaysiaMaldivesMaliMaltaMarshall IslandsMauritaniaMauritiusMexicoMicronesia, Fed. Sts.Middle East & North AfricaMiddle East & North Africa (excluding high income)Middle East & North Africa (IDA & IBRD countries)Middle incomeMoldovaMongoliaMontenegroMoroccoMozambiqueMyanmarNamibiaNauruNepalNetherlandsNew ZealandNicaraguaNigerNigeriaNorth AmericaNorwayOECD membersOmanOther small statesPacific island small statesPakistanPalauPanamaPapua New GuineaParaguayPeruPhilippinesPolandPortugalPost-demographic dividendPre-demographic dividendPuerto RicoQatarRomaniaRussian FederationRwandaSamoaSao Tome and PrincipeSaudi ArabiaSenegalSerbiaSeychellesSierra LeoneSingaporeSlovak RepublicSloveniaSmall statesSolomon IslandsSouth AfricaSouth AsiaSouth Asia (IDA & IBRD)South SudanSpainSri LankaSt. Kitts and NevisSt. LuciaSt. Vincent and the GrenadinesSub-Saharan Africa Sub-Saharan Africa (excluding high income)Sub-Saharan Africa (IDA & IBRD countries)SudanSurinameSwazilandSwedenSwitzerlandTajikistanTanzaniaThailandTimor-LesteTogoTongaTrinidad and TobagoTunisiaTurkeyTurkmenistanTuvaluUgandaUkraineUnited Arab EmiratesUnited KingdomUnited StatesUpper middle incomeUruguayUzbekistanVanuatuVenezuela, RBVietnamWest Bank and GazaWorldYemen, Rep.ZambiaZimbabwe Timeline:
This timeline shows a graph from 1966 to 2016 of Lower middle income. No data until 1965. Number of actual observations by date: 51.
Source name:
World Development Indicators
Source organization:
World Bank national accounts data, and OECD National Accounts data files.
Categories, topics:
Economy & Growth
Last updated:
apr 23, 2017
Indicators value changes by year
Minimum:
501.069
jan 1, 1967
Maximum:
2.016K
jan 1, 2016
At the date of observation
Value
Absolute change
Change from previous value
jan 1, 1966
505.287
+505.287
0.0%
jan 1, 1967
501.069
-4.218
-0.83%
jan 1, 1968
516.39
+15.321
3.06%
jan 1, 1969
531.324
+14.934
2.89%
jan 1, 1970
552.404
+21.08
3.97%
jan 1, 1971
568.477
+16.073
2.91%
jan 1, 1972
576.399
+7.922
1.39%
jan 1, 1973
577.463
+1.064
0.18%
jan 1, 1974
593.676
+16.213
2.81%
jan 1, 1975
604.008
+10.332
1.74%
jan 1, 1976
629.313
+25.306
4.19%
jan 1, 1977
647.029
+17.715
2.82%
jan 1, 1978
677.008
+29.979
4.63%
jan 1, 1979
703.634
+26.627
3.93%
jan 1, 1980
691.321
-12.313
-1.75%
jan 1, 1981
715.242
+23.921
3.46%
jan 1, 1982
738.694
+23.452
3.28%
jan 1, 1983
741.125
+2.431
0.33%
jan 1, 1984
769.593
+28.468
3.84%
jan 1, 1985
772.181
+2.588
0.34%
jan 1, 1986
779.5
+7.319
0.95%
jan 1, 1987
794.769
+15.269
1.96%
jan 1, 1988
816.76
+21.991
2.77%
jan 1, 1989
851.183
+34.423
4.21%
jan 1, 1990
879.843
+28.661
3.37%
jan 1, 1991
905.739
+25.895
2.94%
jan 1, 1992
881.89
-23.849
-2.63%
jan 1, 1993
889.792
+7.902
0.9%
jan 1, 1994
910.758
+20.965
2.36%
jan 1, 1995
928.997
+18.239
2.0%
jan 1, 1996
957.986
+28.989
3.12%
jan 1, 1997
996.911
+38.925
4.06%
jan 1, 1998
1.019K
+22.1
2.22%
jan 1, 1999
1.002K
-17.413
-1.71%
jan 1, 2000
1.027K
+25.744
2.57%
jan 1, 2001
1.049K
+21.767
2.12%
jan 1, 2002
1.079K
+29.724
2.83%
jan 1, 2003
1.101K
+22.127
2.05%
jan 1, 2004
1.175K
+73.552
6.68%
jan 1, 2005
1.249K
+74.126
6.31%
jan 1, 2006
1.31K
+61.682
4.94%
jan 1, 2007
1.398K
+87.435
6.67%
jan 1, 2008
1.474K
+76.074
5.44%
jan 1, 2009
1.523K
+49.039
3.33%
jan 1, 2010
1.575K
+51.941
3.41%
jan 1, 2011
1.669K
+93.77
5.95%
jan 1, 2012
1.724K
+55.414
3.32%
jan 1, 2013
1.786K
+62.211
3.61%
jan 1, 2014
1.854K
+67.367
3.77%
jan 1, 2015
1.936K
+82.288
4.44%
jan 1, 2016
2.016K
+80.13
4.14%
Ranking of countries by current statistics by years


Comments: