29
/
en
AIzaSyAYiBZKx7MnpbEhh9jyipgxe19OcubqV5w
April 1, 2024
43442
Latin America & the Caribbean (IDA & IBRD countries)
TLA
false
2
1
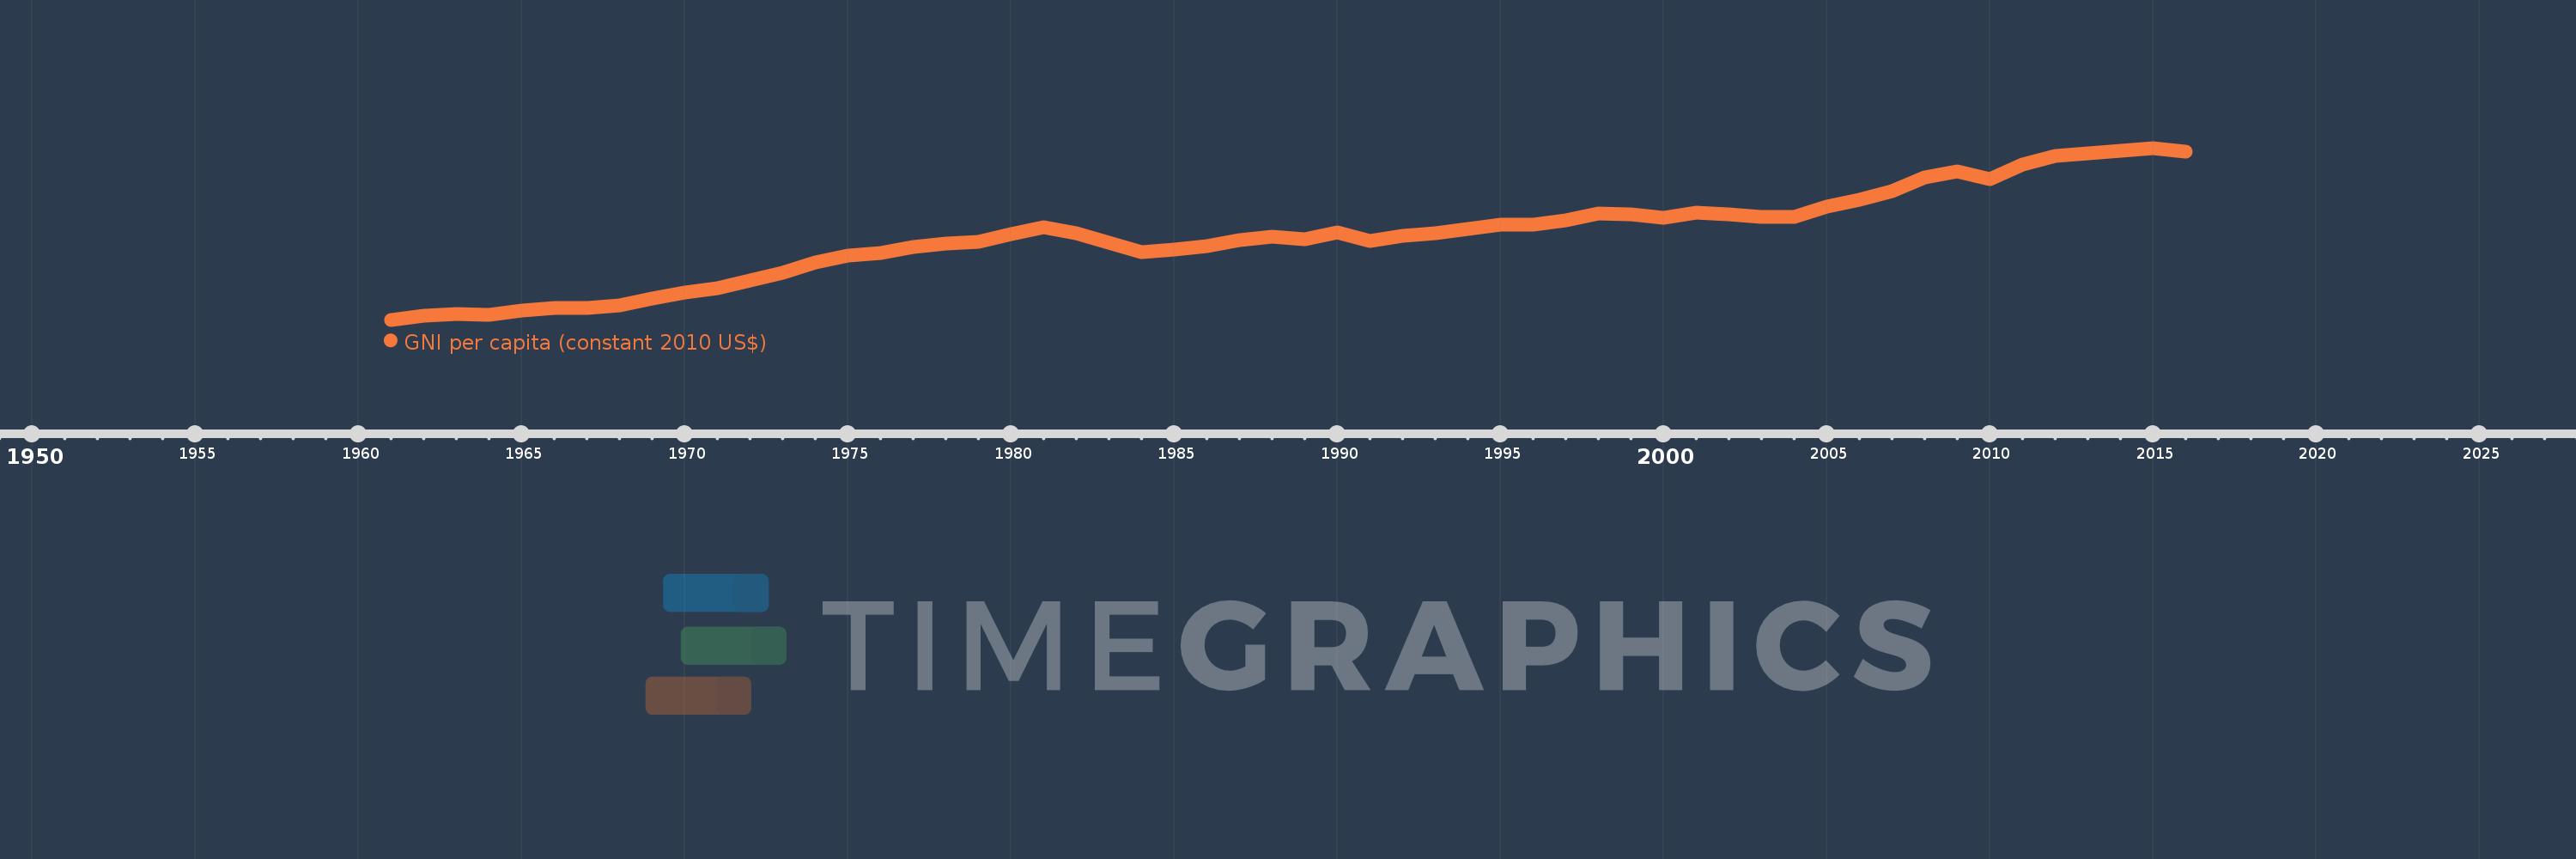
GNI per capita (constant 2010 US$)
2016,2015,2014,2013,2012,2011,2010,2009,2008,2007,2006,2005,2004,2003,2002,2001,2000,1999,1998,1997,1996,1995,1994,1993,1992,1991,1990,1989,1988,1987,1986,1985,1984,1983,1982,1981,1980,1979,1978,1977,1976,1975,1974,1973,1972,1971,1970,1969,1968,1967,1966,1965,1964,1963,1962,1961
This statistics in other country:
AfghanistanAlbaniaAlgeriaAndorraAngolaAntigua and BarbudaArab WorldArgentinaArmeniaAustraliaAustriaAzerbaijanBahamas, TheBahrainBangladeshBarbadosBelarusBelgiumBelizeBeninBermudaBhutanBoliviaBosnia and HerzegovinaBotswanaBrazilBrunei DarussalamBulgariaBurkina FasoBurundiCabo VerdeCambodiaCameroonCanadaCaribbean small statesCentral African RepublicCentral Europe and the BalticsChadChileChinaColombiaComorosCongo, Dem. Rep.Congo, Rep.Costa RicaCote d'IvoireCroatiaCubaCyprusCzech RepublicDenmarkDominicaDominican RepublicEarly-demographic dividendEast Asia & PacificEast Asia & Pacific (excluding high income)East Asia & Pacific (IDA & IBRD countries)EcuadorEgypt, Arab Rep.El SalvadorEquatorial GuineaEritreaEstoniaEthiopiaEuro areaEurope & Central AsiaEurope & Central Asia (excluding high income)Europe & Central Asia (IDA & IBRD countries)European UnionFaroe IslandsFijiFinlandFragile and conflict affected situationsFranceGabonGambia, TheGeorgiaGermanyGhanaGreeceGrenadaGuatemalaGuineaGuinea-BissauGuyanaHaitiHeavily indebted poor countries (HIPC)High incomeHondurasHong Kong SAR, ChinaHungaryIBRD onlyIcelandIDA & IBRD totalIDA blendIDA onlyIDA totalIndiaIndonesiaIran, Islamic Rep.IraqIrelandIsle of ManIsraelItalyJamaicaJapanJordanKazakhstanKenyaKiribatiKorea, Rep.KosovoKuwaitKyrgyz RepublicLao PDRLate-demographic dividendLatin America & Caribbean Latin America & Caribbean (excluding high income)Latin America & the Caribbean (IDA & IBRD countries)LatviaLeast developed countries: UN classificationLebanonLesothoLiberiaLibyaLiechtensteinLithuaniaLow & middle incomeLow incomeLower middle incomeLuxembourgMacao SAR, ChinaMacedonia, FYRMadagascarMalawiMalaysiaMaldivesMaliMaltaMarshall IslandsMauritaniaMauritiusMexicoMicronesia, Fed. Sts.Middle East & North AfricaMiddle East & North Africa (excluding high income)Middle East & North Africa (IDA & IBRD countries)Middle incomeMoldovaMongoliaMontenegroMoroccoMozambiqueMyanmarNamibiaNauruNepalNetherlandsNew ZealandNicaraguaNigerNigeriaNorth AmericaNorwayOECD membersOmanOther small statesPacific island small statesPakistanPalauPanamaPapua New GuineaParaguayPeruPhilippinesPolandPortugalPost-demographic dividendPre-demographic dividendPuerto RicoQatarRomaniaRussian FederationRwandaSamoaSao Tome and PrincipeSaudi ArabiaSenegalSerbiaSeychellesSierra LeoneSingaporeSlovak RepublicSloveniaSmall statesSolomon IslandsSouth AfricaSouth AsiaSouth Asia (IDA & IBRD)South SudanSpainSri LankaSt. Kitts and NevisSt. LuciaSt. Vincent and the GrenadinesSub-Saharan Africa Sub-Saharan Africa (excluding high income)Sub-Saharan Africa (IDA & IBRD countries)SudanSurinameSwazilandSwedenSwitzerlandTajikistanTanzaniaThailandTimor-LesteTogoTongaTrinidad and TobagoTunisiaTurkeyTurkmenistanTuvaluUgandaUkraineUnited Arab EmiratesUnited KingdomUnited StatesUpper middle incomeUruguayUzbekistanVanuatuVenezuela, RBVietnamWest Bank and GazaWorldYemen, Rep.ZambiaZimbabwe Timeline:
This timeline shows a graph from 1961 to 2016 of Latin America & the Caribbean (IDA & IBRD countries). No data until 1960. Number of actual observations by date: 56.
Source name:
World Development Indicators
Source organization:
World Bank national accounts data, and OECD National Accounts data files.
Categories, topics:
Economy & Growth
Last updated:
apr 23, 2017
Indicators value changes by year
Minimum:
3.514K
jan 1, 1961
Maximum:
9.204K
jan 1, 2015
At the date of observation
Value
Absolute change
Change from previous value
jan 1, 1961
3.514K
+3.514K
0.0%
jan 1, 1962
3.659K
+145.082
4.13%
jan 1, 1963
3.708K
+48.964
1.34%
jan 1, 1964
3.68K
-28.349
-0.76%
jan 1, 1965
3.821K
+141.46
3.84%
jan 1, 1966
3.913K
+91.644
2.4%
jan 1, 1967
3.908K
-4.495
-0.11%
jan 1, 1968
3.989K
+80.498
2.06%
jan 1, 1969
4.209K
+220.306
5.52%
jan 1, 1970
4.407K
+198.489
4.72%
jan 1, 1971
4.568K
+160.808
3.65%
jan 1, 1972
4.825K
+256.64
5.62%
jan 1, 1973
5.07K
+245.448
5.09%
jan 1, 1974
5.403K
+332.606
6.56%
jan 1, 1975
5.648K
+244.72
4.53%
jan 1, 1976
5.724K
+76.566
1.36%
jan 1, 1977
5.921K
+196.621
3.43%
jan 1, 1978
6.042K
+121.551
2.05%
jan 1, 1979
6.104K
+61.287
1.01%
jan 1, 1980
6.343K
+238.961
3.92%
jan 1, 1981
6.588K
+244.892
3.86%
jan 1, 1982
6.392K
-195.047
-2.96%
jan 1, 1983
6.066K
-326.246
-5.1%
jan 1, 1984
5.753K
-313.17
-5.16%
jan 1, 1985
5.848K
+94.642
1.65%
jan 1, 1986
5.954K
+106.585
1.82%
jan 1, 1987
6.139K
+185.077
3.11%
jan 1, 1988
6.258K
+118.863
1.94%
jan 1, 1989
6.19K
-68.05
-1.09%
jan 1, 1990
6.396K
+206.048
3.33%
jan 1, 1991
6.121K
-275.229
-4.3%
jan 1, 1992
6.28K
+159.015
2.6%
jan 1, 1993
6.372K
+91.844
1.46%
jan 1, 1994
6.52K
+148.318
2.33%
jan 1, 1995
6.667K
+146.473
2.25%
jan 1, 1996
6.649K
-17.337
-0.26%
jan 1, 1997
6.791K
+141.952
2.13%
jan 1, 1998
7.02K
+229.043
3.37%
jan 1, 1999
7.018K
-2.271
-0.03%
jan 1, 2000
6.882K
-135.8
-1.94%
jan 1, 2001
7.063K
+180.942
2.63%
jan 1, 2002
7.018K
-45.184
-0.64%
jan 1, 2003
6.915K
-102.905
-1.47%
jan 1, 2004
6.914K
-0.616
-0.01%
jan 1, 2005
7.262K
+347.041
5.02%
jan 1, 2006
7.498K
+236.593
3.26%
jan 1, 2007
7.787K
+288.451
3.85%
jan 1, 2008
8.216K
+429.422
5.51%
jan 1, 2009
8.436K
+219.826
2.68%
jan 1, 2010
8.176K
-259.477
-3.08%
jan 1, 2011
8.663K
+486.576
5.95%
jan 1, 2012
8.925K
+262.022
3.02%
jan 1, 2013
9.019K
+93.667
1.05%
jan 1, 2014
9.102K
+83.534
0.93%
jan 1, 2015
9.204K
+101.541
1.12%
jan 1, 2016
9.085K
-118.713
-1.29%
Ranking of countries by current statistics by years


Comments: