29
/
en
AIzaSyAYiBZKx7MnpbEhh9jyipgxe19OcubqV5w
April 1, 2024
272263
Uganda
UGA
true
2
1
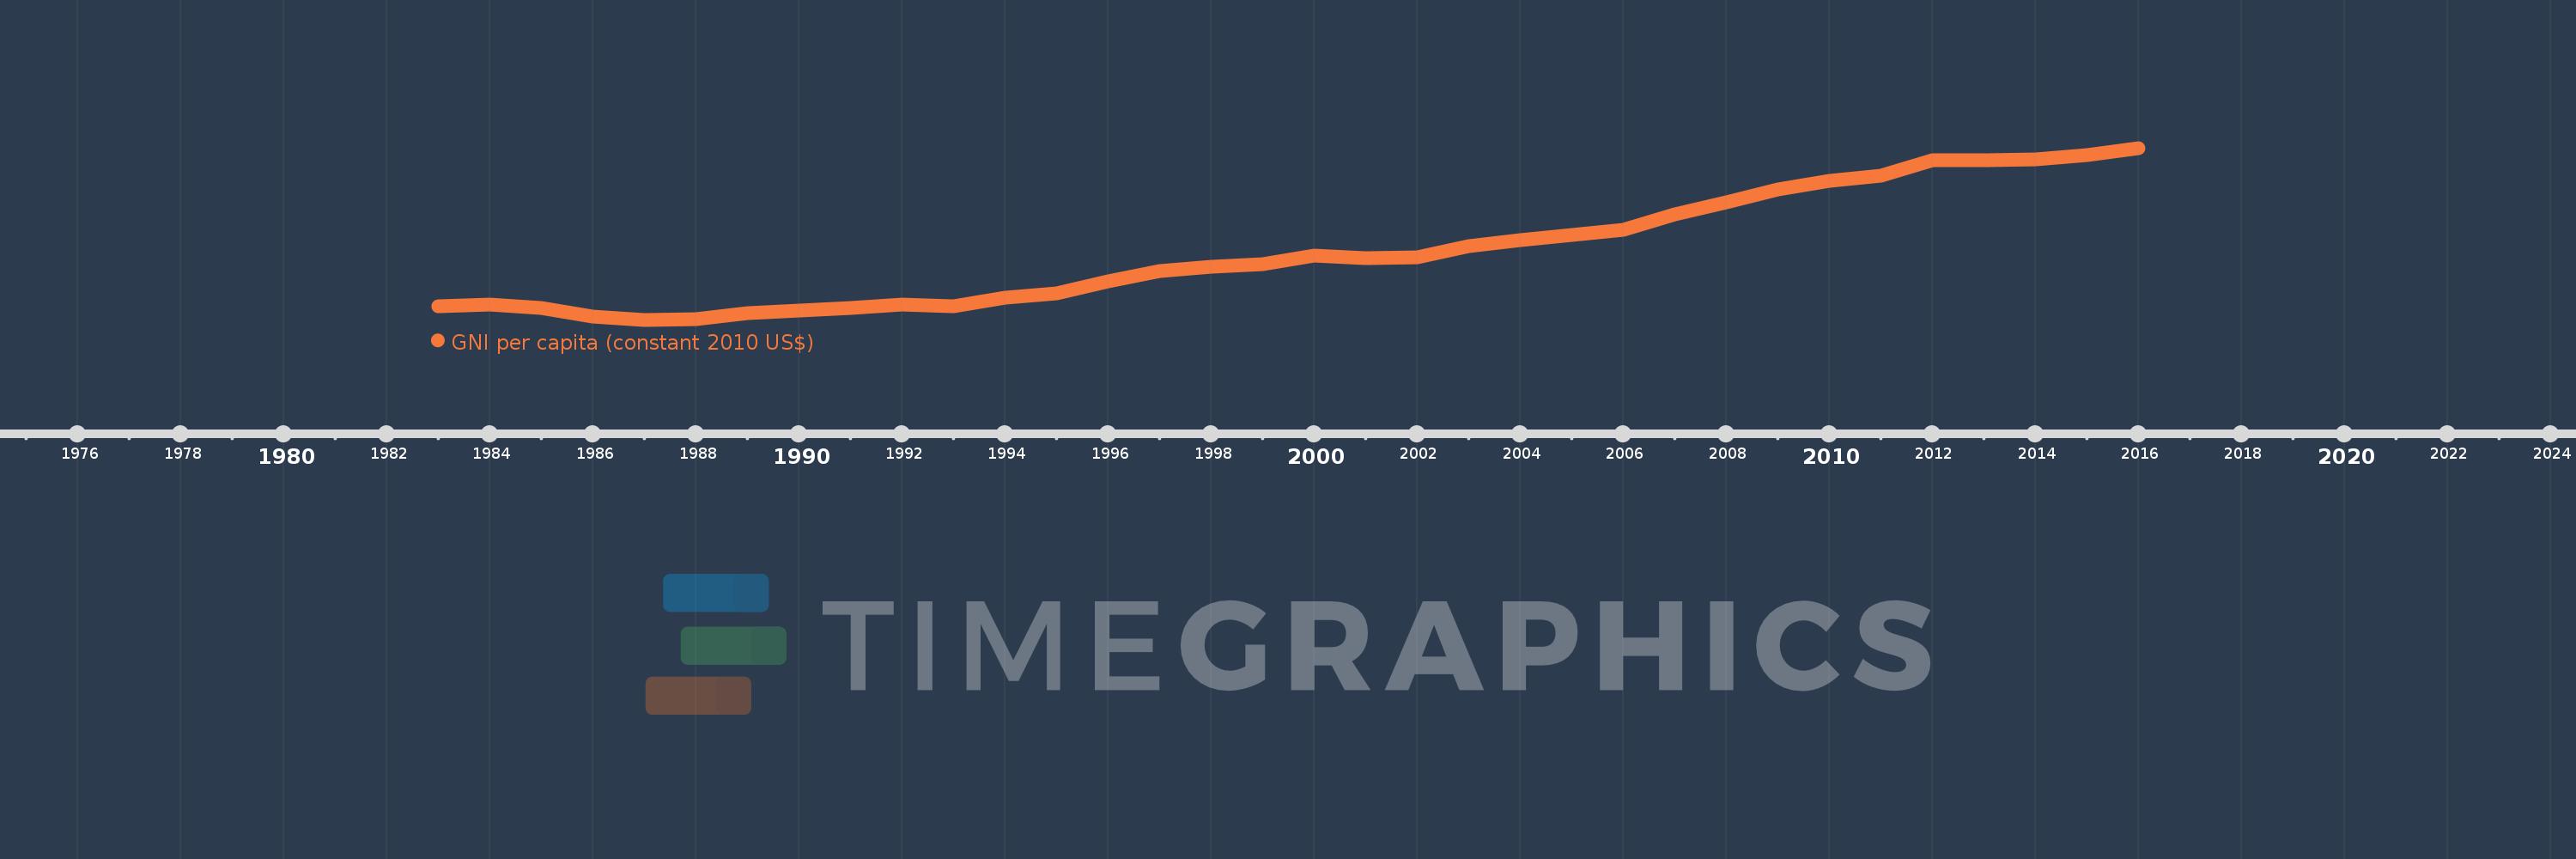
GNI per capita (constant 2010 US$)
2016,2015,2014,2013,2012,2011,2010,2009,2008,2007,2006,2005,2004,2003,2002,2001,2000,1999,1998,1997,1996,1995,1994,1993,1992,1991,1990,1989,1988,1987,1986,1985,1984,1983
This statistics in other country:
AfghanistanAlbaniaAlgeriaAndorraAngolaAntigua and BarbudaArab WorldArgentinaArmeniaAustraliaAustriaAzerbaijanBahamas, TheBahrainBangladeshBarbadosBelarusBelgiumBelizeBeninBermudaBhutanBoliviaBosnia and HerzegovinaBotswanaBrazilBrunei DarussalamBulgariaBurkina FasoBurundiCabo VerdeCambodiaCameroonCanadaCaribbean small statesCentral African RepublicCentral Europe and the BalticsChadChileChinaColombiaComorosCongo, Dem. Rep.Congo, Rep.Costa RicaCote d'IvoireCroatiaCubaCyprusCzech RepublicDenmarkDominicaDominican RepublicEarly-demographic dividendEast Asia & PacificEast Asia & Pacific (excluding high income)East Asia & Pacific (IDA & IBRD countries)EcuadorEgypt, Arab Rep.El SalvadorEquatorial GuineaEritreaEstoniaEthiopiaEuro areaEurope & Central AsiaEurope & Central Asia (excluding high income)Europe & Central Asia (IDA & IBRD countries)European UnionFaroe IslandsFijiFinlandFragile and conflict affected situationsFranceGabonGambia, TheGeorgiaGermanyGhanaGreeceGrenadaGuatemalaGuineaGuinea-BissauGuyanaHaitiHeavily indebted poor countries (HIPC)High incomeHondurasHong Kong SAR, ChinaHungaryIBRD onlyIcelandIDA & IBRD totalIDA blendIDA onlyIDA totalIndiaIndonesiaIran, Islamic Rep.IraqIrelandIsle of ManIsraelItalyJamaicaJapanJordanKazakhstanKenyaKiribatiKorea, Rep.KosovoKuwaitKyrgyz RepublicLao PDRLate-demographic dividendLatin America & Caribbean Latin America & Caribbean (excluding high income)Latin America & the Caribbean (IDA & IBRD countries)LatviaLeast developed countries: UN classificationLebanonLesothoLiberiaLibyaLiechtensteinLithuaniaLow & middle incomeLow incomeLower middle incomeLuxembourgMacao SAR, ChinaMacedonia, FYRMadagascarMalawiMalaysiaMaldivesMaliMaltaMarshall IslandsMauritaniaMauritiusMexicoMicronesia, Fed. Sts.Middle East & North AfricaMiddle East & North Africa (excluding high income)Middle East & North Africa (IDA & IBRD countries)Middle incomeMoldovaMongoliaMontenegroMoroccoMozambiqueMyanmarNamibiaNauruNepalNetherlandsNew ZealandNicaraguaNigerNigeriaNorth AmericaNorwayOECD membersOmanOther small statesPacific island small statesPakistanPalauPanamaPapua New GuineaParaguayPeruPhilippinesPolandPortugalPost-demographic dividendPre-demographic dividendPuerto RicoQatarRomaniaRussian FederationRwandaSamoaSao Tome and PrincipeSaudi ArabiaSenegalSerbiaSeychellesSierra LeoneSingaporeSlovak RepublicSloveniaSmall statesSolomon IslandsSouth AfricaSouth AsiaSouth Asia (IDA & IBRD)South SudanSpainSri LankaSt. Kitts and NevisSt. LuciaSt. Vincent and the GrenadinesSub-Saharan Africa Sub-Saharan Africa (excluding high income)Sub-Saharan Africa (IDA & IBRD countries)SudanSurinameSwazilandSwedenSwitzerlandTajikistanTanzaniaThailandTimor-LesteTogoTongaTrinidad and TobagoTunisiaTurkeyTurkmenistanTuvaluUgandaUkraineUnited Arab EmiratesUnited KingdomUnited StatesUpper middle incomeUruguayUzbekistanVanuatuVenezuela, RBVietnamWest Bank and GazaWorldYemen, Rep.ZambiaZimbabwe Timeline:
This timeline shows a graph from 1983 to 2016 of Uganda. No data until 1982. Number of actual observations by date: 34.
Source name:
World Development Indicators
Source organization:
World Bank national accounts data, and OECD National Accounts data files.
Categories, topics:
Economy & Growth
Last updated:
apr 23, 2017
Indicators value changes by year
Minimum:
269.716
jan 1, 1987
Maximum:
662.019
jan 1, 2016
At the date of observation
Value
Absolute change
Change from previous value
jan 1, 1983
299.584
+299.584
0.0%
jan 1, 1984
304.349
+4.765
1.59%
jan 1, 1985
296.309
-8.04
-2.64%
jan 1, 1986
276.662
-19.647
-6.63%
jan 1, 1987
269.716
-6.946
-2.51%
jan 1, 1988
272.064
+2.348
0.87%
jan 1, 1989
284.003
+11.939
4.39%
jan 1, 1990
290.623
+6.62
2.33%
jan 1, 1991
297.535
+6.912
2.38%
jan 1, 1992
304.062
+6.527
2.19%
jan 1, 1993
300.586
-3.475
-1.14%
jan 1, 1994
320.104
+19.518
6.49%
jan 1, 1995
329.86
+9.756
3.05%
jan 1, 1996
358.317
+28.457
8.63%
jan 1, 1997
380.249
+21.931
6.12%
jan 1, 1998
389.86
+9.611
2.53%
jan 1, 1999
397.514
+7.654
1.96%
jan 1, 2000
416.239
+18.725
4.71%
jan 1, 2001
409.621
-6.618
-1.59%
jan 1, 2002
411.56
+1.939
0.47%
jan 1, 2003
437.363
+25.803
6.27%
jan 1, 2004
450.872
+13.509
3.09%
jan 1, 2005
462.609
+11.736
2.6%
jan 1, 2006
474.507
+11.899
2.57%
jan 1, 2007
510.672
+36.164
7.62%
jan 1, 2008
538.323
+27.651
5.41%
jan 1, 2009
566.695
+28.372
5.27%
jan 1, 2010
585.932
+19.237
3.39%
jan 1, 2011
598.777
+12.845
2.19%
jan 1, 2012
634.333
+35.555
5.94%
jan 1, 2013
634.792
+0.46
0.07%
jan 1, 2014
635.559
+0.766
0.12%
jan 1, 2015
646.424
+10.866
1.71%
jan 1, 2016
662.019
+15.595
2.41%
Ranking of countries by current statistics by years


Comments: