29
/
en
AIzaSyAYiBZKx7MnpbEhh9jyipgxe19OcubqV5w
April 1, 2024
167515
Kenya
KEN
true
2
1
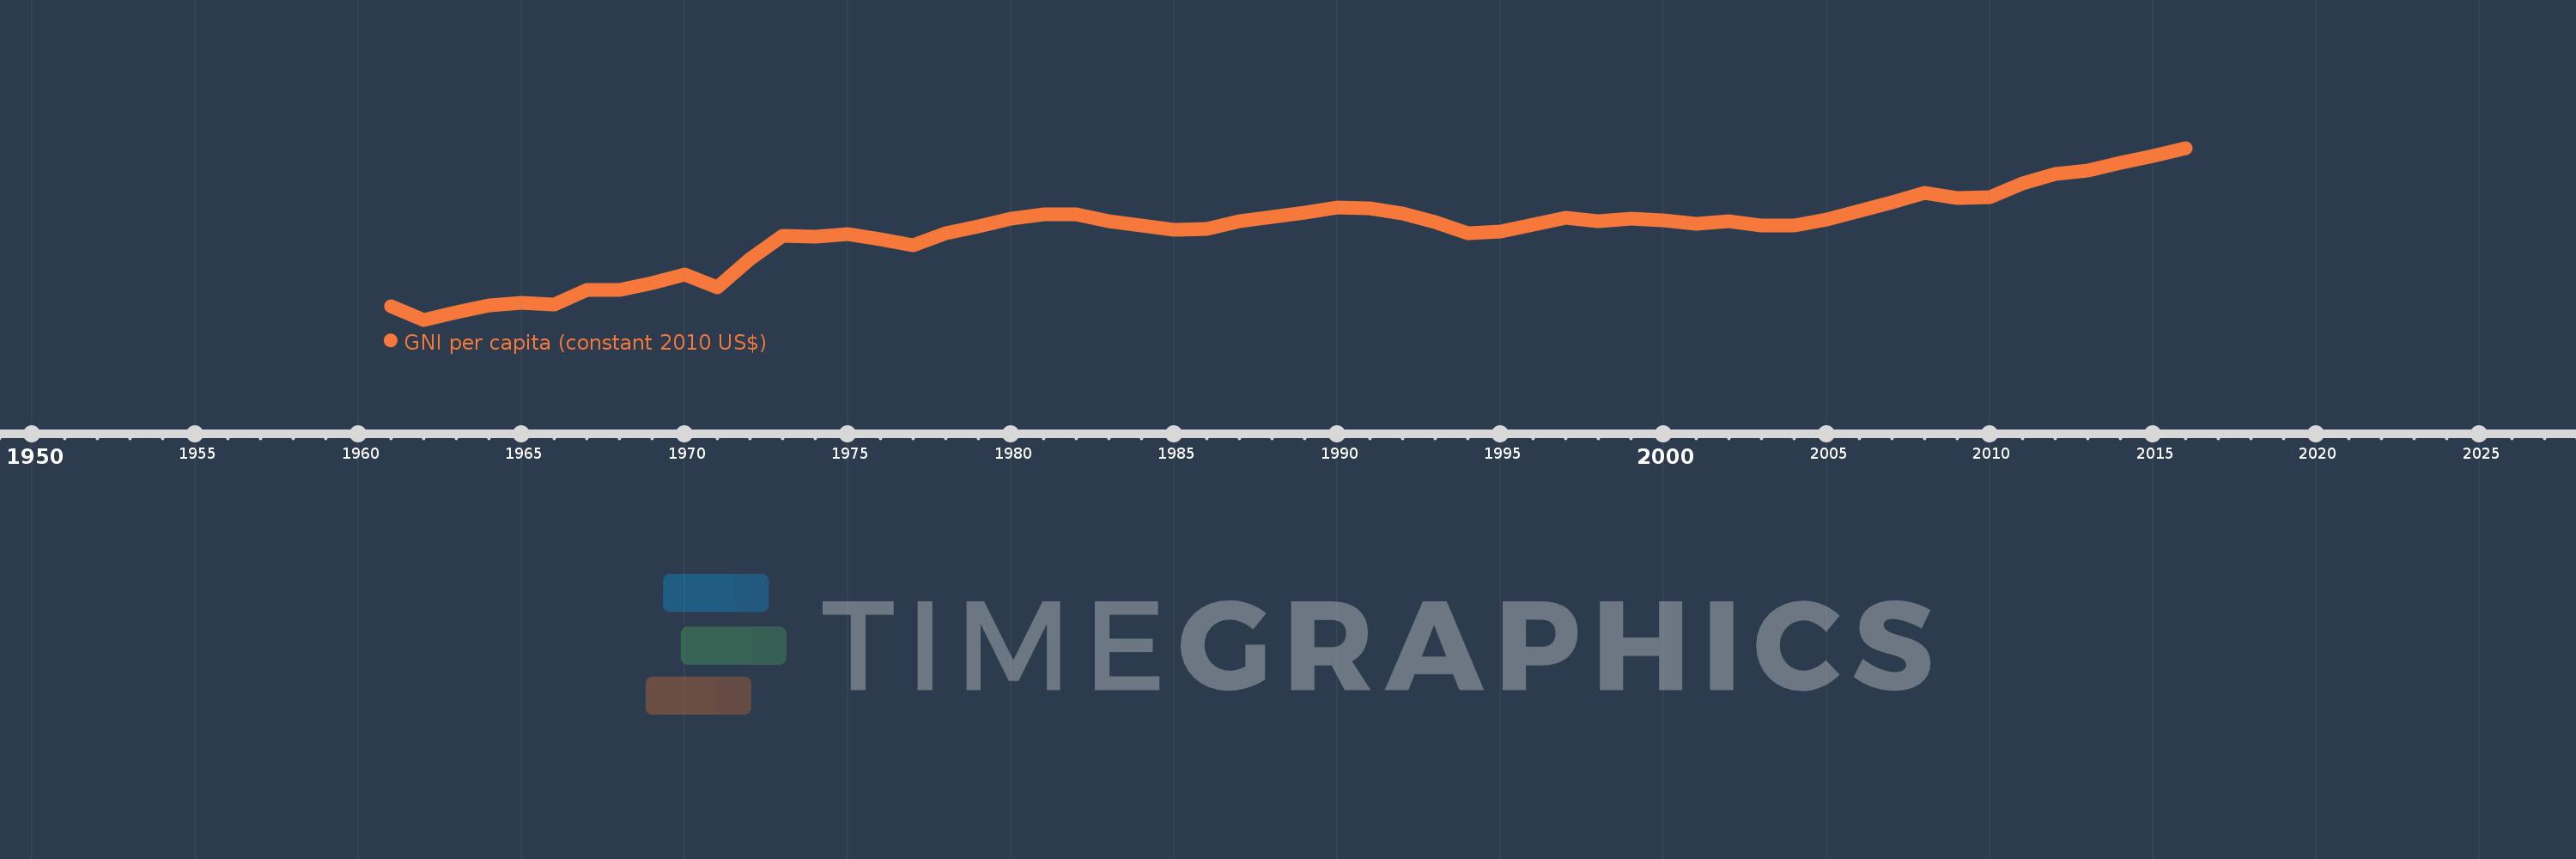
GNI per capita (constant 2010 US$)
2016,2015,2014,2013,2012,2011,2010,2009,2008,2007,2006,2005,2004,2003,2002,2001,2000,1999,1998,1997,1996,1995,1994,1993,1992,1991,1990,1989,1988,1987,1986,1985,1984,1983,1982,1981,1980,1979,1978,1977,1976,1975,1974,1973,1972,1971,1970,1969,1968,1967,1966,1965,1964,1963,1962,1961
This statistics in other country:
AfghanistanAlbaniaAlgeriaAndorraAngolaAntigua and BarbudaArab WorldArgentinaArmeniaAustraliaAustriaAzerbaijanBahamas, TheBahrainBangladeshBarbadosBelarusBelgiumBelizeBeninBermudaBhutanBoliviaBosnia and HerzegovinaBotswanaBrazilBrunei DarussalamBulgariaBurkina FasoBurundiCabo VerdeCambodiaCameroonCanadaCaribbean small statesCentral African RepublicCentral Europe and the BalticsChadChileChinaColombiaComorosCongo, Dem. Rep.Congo, Rep.Costa RicaCote d'IvoireCroatiaCubaCyprusCzech RepublicDenmarkDominicaDominican RepublicEarly-demographic dividendEast Asia & PacificEast Asia & Pacific (excluding high income)East Asia & Pacific (IDA & IBRD countries)EcuadorEgypt, Arab Rep.El SalvadorEquatorial GuineaEritreaEstoniaEthiopiaEuro areaEurope & Central AsiaEurope & Central Asia (excluding high income)Europe & Central Asia (IDA & IBRD countries)European UnionFaroe IslandsFijiFinlandFragile and conflict affected situationsFranceGabonGambia, TheGeorgiaGermanyGhanaGreeceGrenadaGuatemalaGuineaGuinea-BissauGuyanaHaitiHeavily indebted poor countries (HIPC)High incomeHondurasHong Kong SAR, ChinaHungaryIBRD onlyIcelandIDA & IBRD totalIDA blendIDA onlyIDA totalIndiaIndonesiaIran, Islamic Rep.IraqIrelandIsle of ManIsraelItalyJamaicaJapanJordanKazakhstanKenyaKiribatiKorea, Rep.KosovoKuwaitKyrgyz RepublicLao PDRLate-demographic dividendLatin America & Caribbean Latin America & Caribbean (excluding high income)Latin America & the Caribbean (IDA & IBRD countries)LatviaLeast developed countries: UN classificationLebanonLesothoLiberiaLibyaLiechtensteinLithuaniaLow & middle incomeLow incomeLower middle incomeLuxembourgMacao SAR, ChinaMacedonia, FYRMadagascarMalawiMalaysiaMaldivesMaliMaltaMarshall IslandsMauritaniaMauritiusMexicoMicronesia, Fed. Sts.Middle East & North AfricaMiddle East & North Africa (excluding high income)Middle East & North Africa (IDA & IBRD countries)Middle incomeMoldovaMongoliaMontenegroMoroccoMozambiqueMyanmarNamibiaNauruNepalNetherlandsNew ZealandNicaraguaNigerNigeriaNorth AmericaNorwayOECD membersOmanOther small statesPacific island small statesPakistanPalauPanamaPapua New GuineaParaguayPeruPhilippinesPolandPortugalPost-demographic dividendPre-demographic dividendPuerto RicoQatarRomaniaRussian FederationRwandaSamoaSao Tome and PrincipeSaudi ArabiaSenegalSerbiaSeychellesSierra LeoneSingaporeSlovak RepublicSloveniaSmall statesSolomon IslandsSouth AfricaSouth AsiaSouth Asia (IDA & IBRD)South SudanSpainSri LankaSt. Kitts and NevisSt. LuciaSt. Vincent and the GrenadinesSub-Saharan Africa Sub-Saharan Africa (excluding high income)Sub-Saharan Africa (IDA & IBRD countries)SudanSurinameSwazilandSwedenSwitzerlandTajikistanTanzaniaThailandTimor-LesteTogoTongaTrinidad and TobagoTunisiaTurkeyTurkmenistanTuvaluUgandaUkraineUnited Arab EmiratesUnited KingdomUnited StatesUpper middle incomeUruguayUzbekistanVanuatuVenezuela, RBVietnamWest Bank and GazaWorldYemen, Rep.ZambiaZimbabwe Timeline:
This timeline shows a graph from 1961 to 2016 of Kenya. No data until 1960. Number of actual observations by date: 56.
Source name:
World Development Indicators
Source organization:
World Bank national accounts data, and OECD National Accounts data files.
Categories, topics:
Economy & Growth
Last updated:
apr 23, 2017
Indicators value changes by year
Minimum:
467.394
jan 1, 1962
Maximum:
1.125K
jan 1, 2016
At the date of observation
Value
Absolute change
Change from previous value
jan 1, 1961
520.563
+520.563
0.0%
jan 1, 1962
467.394
-53.168
-10.21%
jan 1, 1963
497.049
+29.654
6.34%
jan 1, 1964
522.041
+24.993
5.03%
jan 1, 1965
530.598
+8.557
1.64%
jan 1, 1966
525.94
-4.658
-0.88%
jan 1, 1967
581.834
+55.894
10.63%
jan 1, 1968
580.783
-1.051
-0.18%
jan 1, 1969
607.666
+26.883
4.63%
jan 1, 1970
641.132
+33.466
5.51%
jan 1, 1971
592.509
-48.623
-7.58%
jan 1, 1972
699.282
+106.773
18.02%
jan 1, 1973
787.831
+88.55
12.66%
jan 1, 1974
785.063
-2.768
-0.35%
jan 1, 1975
794.298
+9.235
1.18%
jan 1, 1976
776.484
-17.813
-2.24%
jan 1, 1977
754.014
-22.47
-2.89%
jan 1, 1978
798.023
+44.009
5.84%
jan 1, 1979
824.07
+26.047
3.26%
jan 1, 1980
853.397
+29.327
3.56%
jan 1, 1981
872.097
+18.7
2.19%
jan 1, 1982
870.483
-1.614
-0.19%
jan 1, 1983
844.988
-25.496
-2.93%
jan 1, 1984
829.834
-15.154
-1.79%
jan 1, 1985
812.629
-17.205
-2.07%
jan 1, 1986
816.014
+3.385
0.42%
jan 1, 1987
843.611
+27.596
3.38%
jan 1, 1988
860.322
+16.711
1.98%
jan 1, 1989
878.899
+18.577
2.16%
jan 1, 1990
897.158
+18.259
2.08%
jan 1, 1991
893.386
-3.772
-0.42%
jan 1, 1992
872.827
-20.559
-2.3%
jan 1, 1993
840.126
-32.701
-3.75%
jan 1, 1994
800.254
-39.871
-4.75%
jan 1, 1995
806.398
+6.144
0.77%
jan 1, 1996
832.28
+25.882
3.21%
jan 1, 1997
857.392
+25.112
3.02%
jan 1, 1998
843.91
-13.482
-1.57%
jan 1, 1999
853.4
+9.49
1.12%
jan 1, 2000
848.413
-4.987
-0.58%
jan 1, 2001
835.319
-13.095
-1.54%
jan 1, 2002
844.023
+8.705
1.04%
jan 1, 2003
828.763
-15.26
-1.81%
jan 1, 2004
829.871
+1.108
0.13%
jan 1, 2005
851.7
+21.828
2.63%
jan 1, 2006
885.771
+34.072
4.0%
jan 1, 2007
916.633
+30.861
3.48%
jan 1, 2008
952.461
+35.828
3.91%
jan 1, 2009
933.084
-19.377
-2.03%
jan 1, 2010
938.428
+5.344
0.57%
jan 1, 2011
988.19
+49.762
5.3%
jan 1, 2012
1.025K
+36.627
3.71%
jan 1, 2013
1.04K
+15.24
1.49%
jan 1, 2014
1.068K
+27.496
2.64%
jan 1, 2015
1.094K
+26.529
2.49%
jan 1, 2016
1.125K
+31.363
2.87%
Ranking of countries by current statistics by years


Comments: