29
/
en
AIzaSyAYiBZKx7MnpbEhh9jyipgxe19OcubqV5w
April 1, 2024
210391
Nicaragua
NIC
true
2
1
GNI per capita (constant 2010 US$)
2016,2015,2014,2013,2012,2011,2010,2009,2008,2007,2006,2005,2004,2003,2002,2001,2000,1999,1998,1997,1996,1995,1994,1993,1992,1991,1990,1989,1988,1987,1986,1985,1984,1983,1982,1981,1980,1979,1978,1977,1976,1975,1974,1973,1972,1971,1970,1969,1968,1967,1966,1965,1964,1963,1962,1961
This statistics in other country:
AfghanistanAlbaniaAlgeriaAndorraAngolaAntigua and BarbudaArab WorldArgentinaArmeniaAustraliaAustriaAzerbaijanBahamas, TheBahrainBangladeshBarbadosBelarusBelgiumBelizeBeninBermudaBhutanBoliviaBosnia and HerzegovinaBotswanaBrazilBrunei DarussalamBulgariaBurkina FasoBurundiCabo VerdeCambodiaCameroonCanadaCaribbean small statesCentral African RepublicCentral Europe and the BalticsChadChileChinaColombiaComorosCongo, Dem. Rep.Congo, Rep.Costa RicaCote d'IvoireCroatiaCubaCyprusCzech RepublicDenmarkDominicaDominican RepublicEarly-demographic dividendEast Asia & PacificEast Asia & Pacific (excluding high income)East Asia & Pacific (IDA & IBRD countries)EcuadorEgypt, Arab Rep.El SalvadorEquatorial GuineaEritreaEstoniaEthiopiaEuro areaEurope & Central AsiaEurope & Central Asia (excluding high income)Europe & Central Asia (IDA & IBRD countries)European UnionFaroe IslandsFijiFinlandFragile and conflict affected situationsFranceGabonGambia, TheGeorgiaGermanyGhanaGreeceGrenadaGuatemalaGuineaGuinea-BissauGuyanaHaitiHeavily indebted poor countries (HIPC)High incomeHondurasHong Kong SAR, ChinaHungaryIBRD onlyIcelandIDA & IBRD totalIDA blendIDA onlyIDA totalIndiaIndonesiaIran, Islamic Rep.IraqIrelandIsle of ManIsraelItalyJamaicaJapanJordanKazakhstanKenyaKiribatiKorea, Rep.KosovoKuwaitKyrgyz RepublicLao PDRLate-demographic dividendLatin America & Caribbean Latin America & Caribbean (excluding high income)Latin America & the Caribbean (IDA & IBRD countries)LatviaLeast developed countries: UN classificationLebanonLesothoLiberiaLibyaLiechtensteinLithuaniaLow & middle incomeLow incomeLower middle incomeLuxembourgMacao SAR, ChinaMacedonia, FYRMadagascarMalawiMalaysiaMaldivesMaliMaltaMarshall IslandsMauritaniaMauritiusMexicoMicronesia, Fed. Sts.Middle East & North AfricaMiddle East & North Africa (excluding high income)Middle East & North Africa (IDA & IBRD countries)Middle incomeMoldovaMongoliaMontenegroMoroccoMozambiqueMyanmarNamibiaNauruNepalNetherlandsNew ZealandNicaraguaNigerNigeriaNorth AmericaNorwayOECD membersOmanOther small statesPacific island small statesPakistanPalauPanamaPapua New GuineaParaguayPeruPhilippinesPolandPortugalPost-demographic dividendPre-demographic dividendPuerto RicoQatarRomaniaRussian FederationRwandaSamoaSao Tome and PrincipeSaudi ArabiaSenegalSerbiaSeychellesSierra LeoneSingaporeSlovak RepublicSloveniaSmall statesSolomon IslandsSouth AfricaSouth AsiaSouth Asia (IDA & IBRD)South SudanSpainSri LankaSt. Kitts and NevisSt. LuciaSt. Vincent and the GrenadinesSub-Saharan Africa Sub-Saharan Africa (excluding high income)Sub-Saharan Africa (IDA & IBRD countries)SudanSurinameSwazilandSwedenSwitzerlandTajikistanTanzaniaThailandTimor-LesteTogoTongaTrinidad and TobagoTunisiaTurkeyTurkmenistanTuvaluUgandaUkraineUnited Arab EmiratesUnited KingdomUnited StatesUpper middle incomeUruguayUzbekistanVanuatuVenezuela, RBVietnamWest Bank and GazaWorldYemen, Rep.ZambiaZimbabwe Timeline:
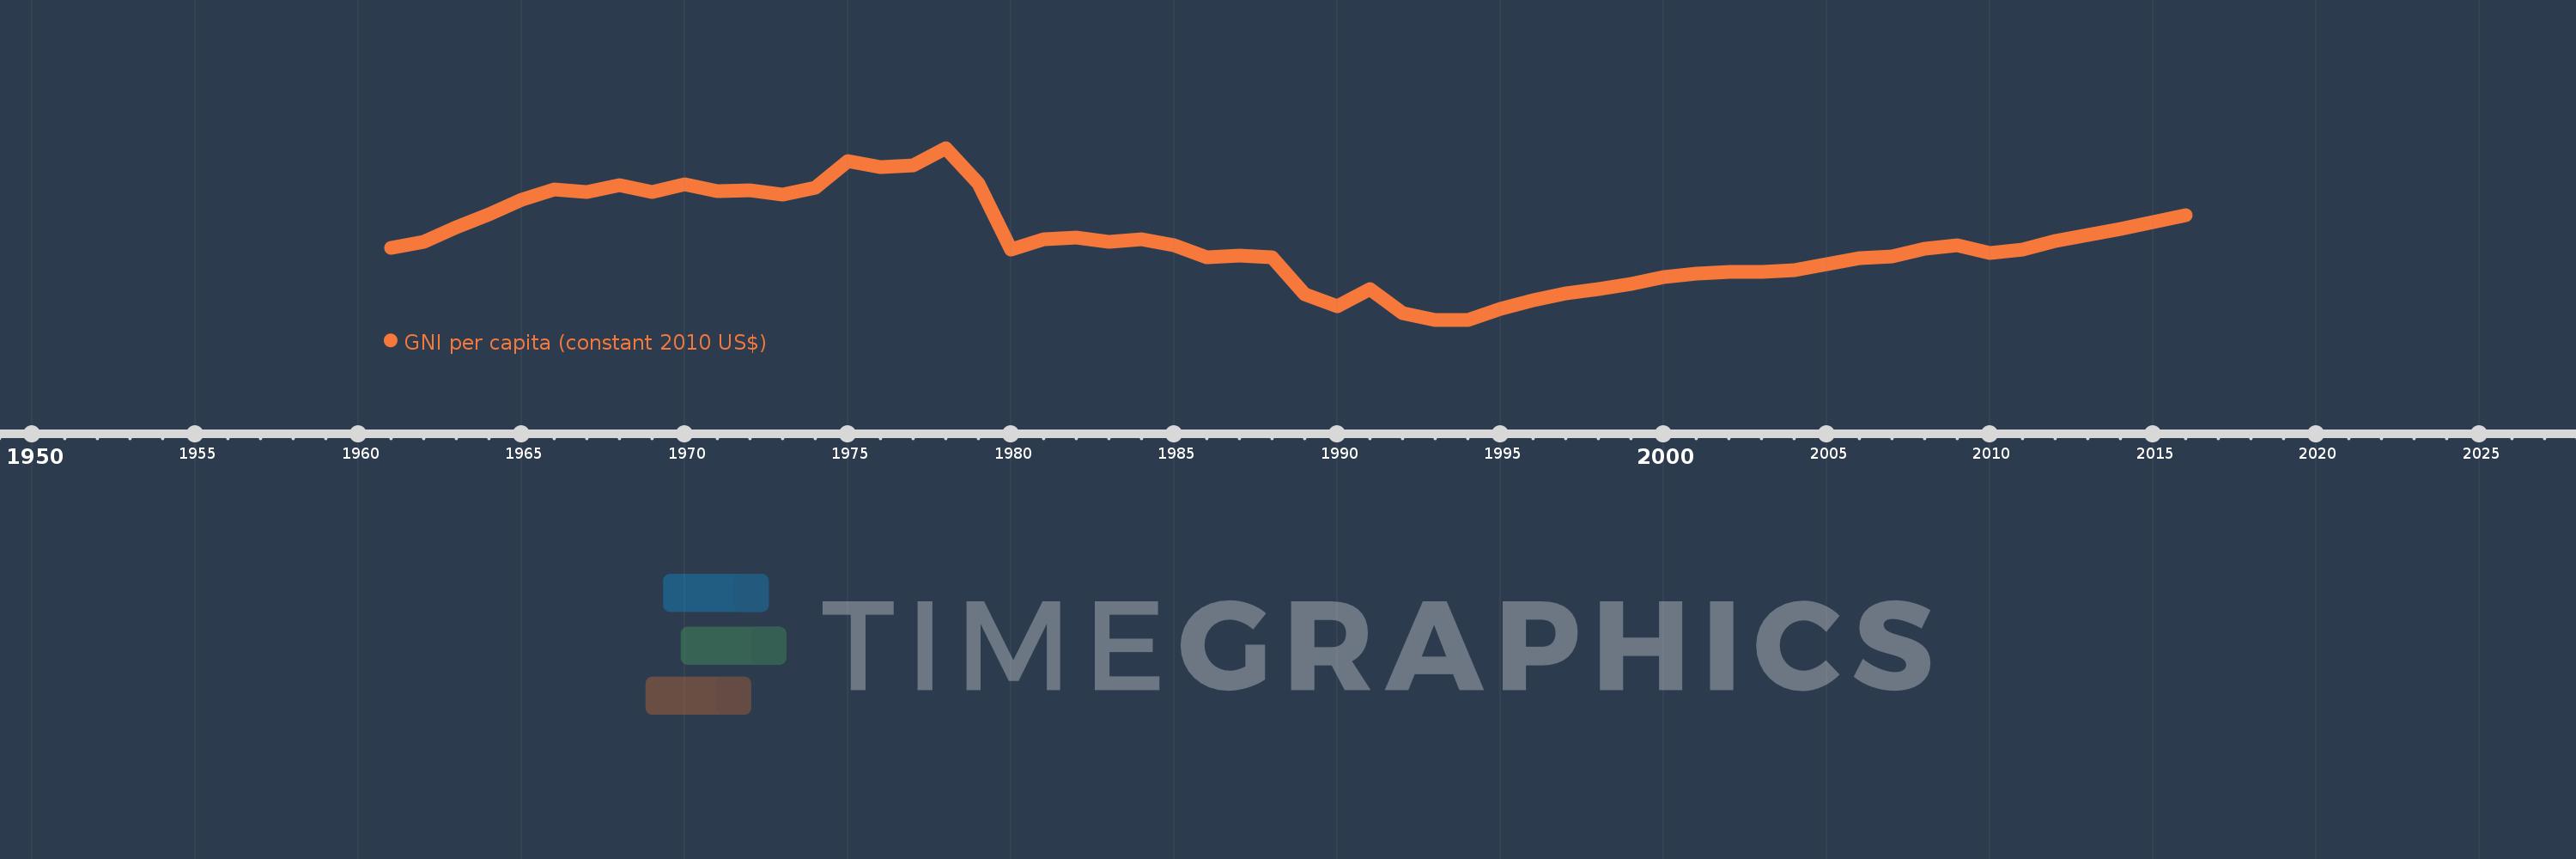
This timeline shows a graph from 1961 to 2016 of Nicaragua. No data until 1960. Number of actual observations by date: 56.
Source name:
World Development Indicators
Source organization:
World Bank national accounts data, and OECD National Accounts data files.
Categories, topics:
Economy & Growth
Last updated:
apr 23, 2017
Indicators value changes by year
Minimum:
839.708
jan 1, 1994
Maximum:
2.411K
jan 1, 1978
At the date of observation
Value
Absolute change
Change from previous value
jan 1, 1961
1.497K
+1.497K
0.0%
jan 1, 1962
1.556K
+59.063
3.95%
jan 1, 1963
1.685K
+128.495
8.26%
jan 1, 1964
1.802K
+117.795
6.99%
jan 1, 1965
1.934K
+131.981
7.32%
jan 1, 1966
2.029K
+94.776
4.9%
jan 1, 1967
2.007K
-22.183
-1.09%
jan 1, 1968
2.073K
+65.99
3.29%
jan 1, 1969
2.007K
-66.047
-3.19%
jan 1, 1970
2.077K
+69.816
3.48%
jan 1, 1971
2.013K
-63.663
-3.07%
jan 1, 1972
2.025K
+11.485
0.57%
jan 1, 1973
1.986K
-39.029
-1.93%
jan 1, 1974
2.049K
+62.994
3.17%
jan 1, 1975
2.291K
+242.852
11.85%
jan 1, 1976
2.236K
-55.34
-2.42%
jan 1, 1977
2.255K
+18.99
0.85%
jan 1, 1978
2.411K
+155.973
6.92%
jan 1, 1979
2.085K
-326.194
-13.53%
jan 1, 1980
1.479K
-606.054
-29.07%
jan 1, 1981
1.576K
+96.847
6.55%
jan 1, 1982
1.594K
+18.026
1.14%
jan 1, 1983
1.549K
-44.702
-2.8%
jan 1, 1984
1.577K
+27.926
1.8%
jan 1, 1985
1.523K
-54.256
-3.44%
jan 1, 1986
1.411K
-111.428
-7.32%
jan 1, 1987
1.429K
+18.055
1.28%
jan 1, 1988
1.413K
-16.106
-1.13%
jan 1, 1989
1.07K
-343.514
-24.31%
jan 1, 1990
962.457
-107.178
-10.02%
jan 1, 1991
1.123K
+160.657
16.69%
jan 1, 1992
897.441
-225.673
-20.09%
jan 1, 1993
840.994
-56.447
-6.29%
jan 1, 1994
839.708
-1.286
-0.15%
jan 1, 1995
941.32
+101.612
12.1%
jan 1, 1996
1.016K
+74.214
7.88%
jan 1, 1997
1.079K
+63.727
6.28%
jan 1, 1998
1.121K
+41.472
3.84%
jan 1, 1999
1.168K
+47.324
4.22%
jan 1, 2000
1.231K
+62.54
5.35%
jan 1, 2001
1.263K
+32.788
2.66%
jan 1, 2002
1.274K
+10.996
0.87%
jan 1, 2003
1.274K
-0.07
-0.01%
jan 1, 2004
1.293K
+18.462
1.45%
jan 1, 2005
1.35K
+57.497
4.45%
jan 1, 2006
1.404K
+53.583
3.97%
jan 1, 2007
1.421K
+17.354
1.24%
jan 1, 2008
1.49K
+68.633
4.83%
jan 1, 2009
1.518K
+28.114
1.89%
jan 1, 2010
1.449K
-68.456
-4.51%
jan 1, 2011
1.481K
+32.0
2.21%
jan 1, 2012
1.558K
+76.168
5.14%
jan 1, 2013
1.616K
+58.648
3.77%
jan 1, 2014
1.673K
+56.73
3.51%
jan 1, 2015
1.735K
+62.292
3.72%
jan 1, 2016
1.797K
+61.928
3.57%
Ranking of countries by current statistics by years


Comments: