29
/
en
AIzaSyAYiBZKx7MnpbEhh9jyipgxe19OcubqV5w
April 1, 2024
84111
Benin
BEN
true
2
1
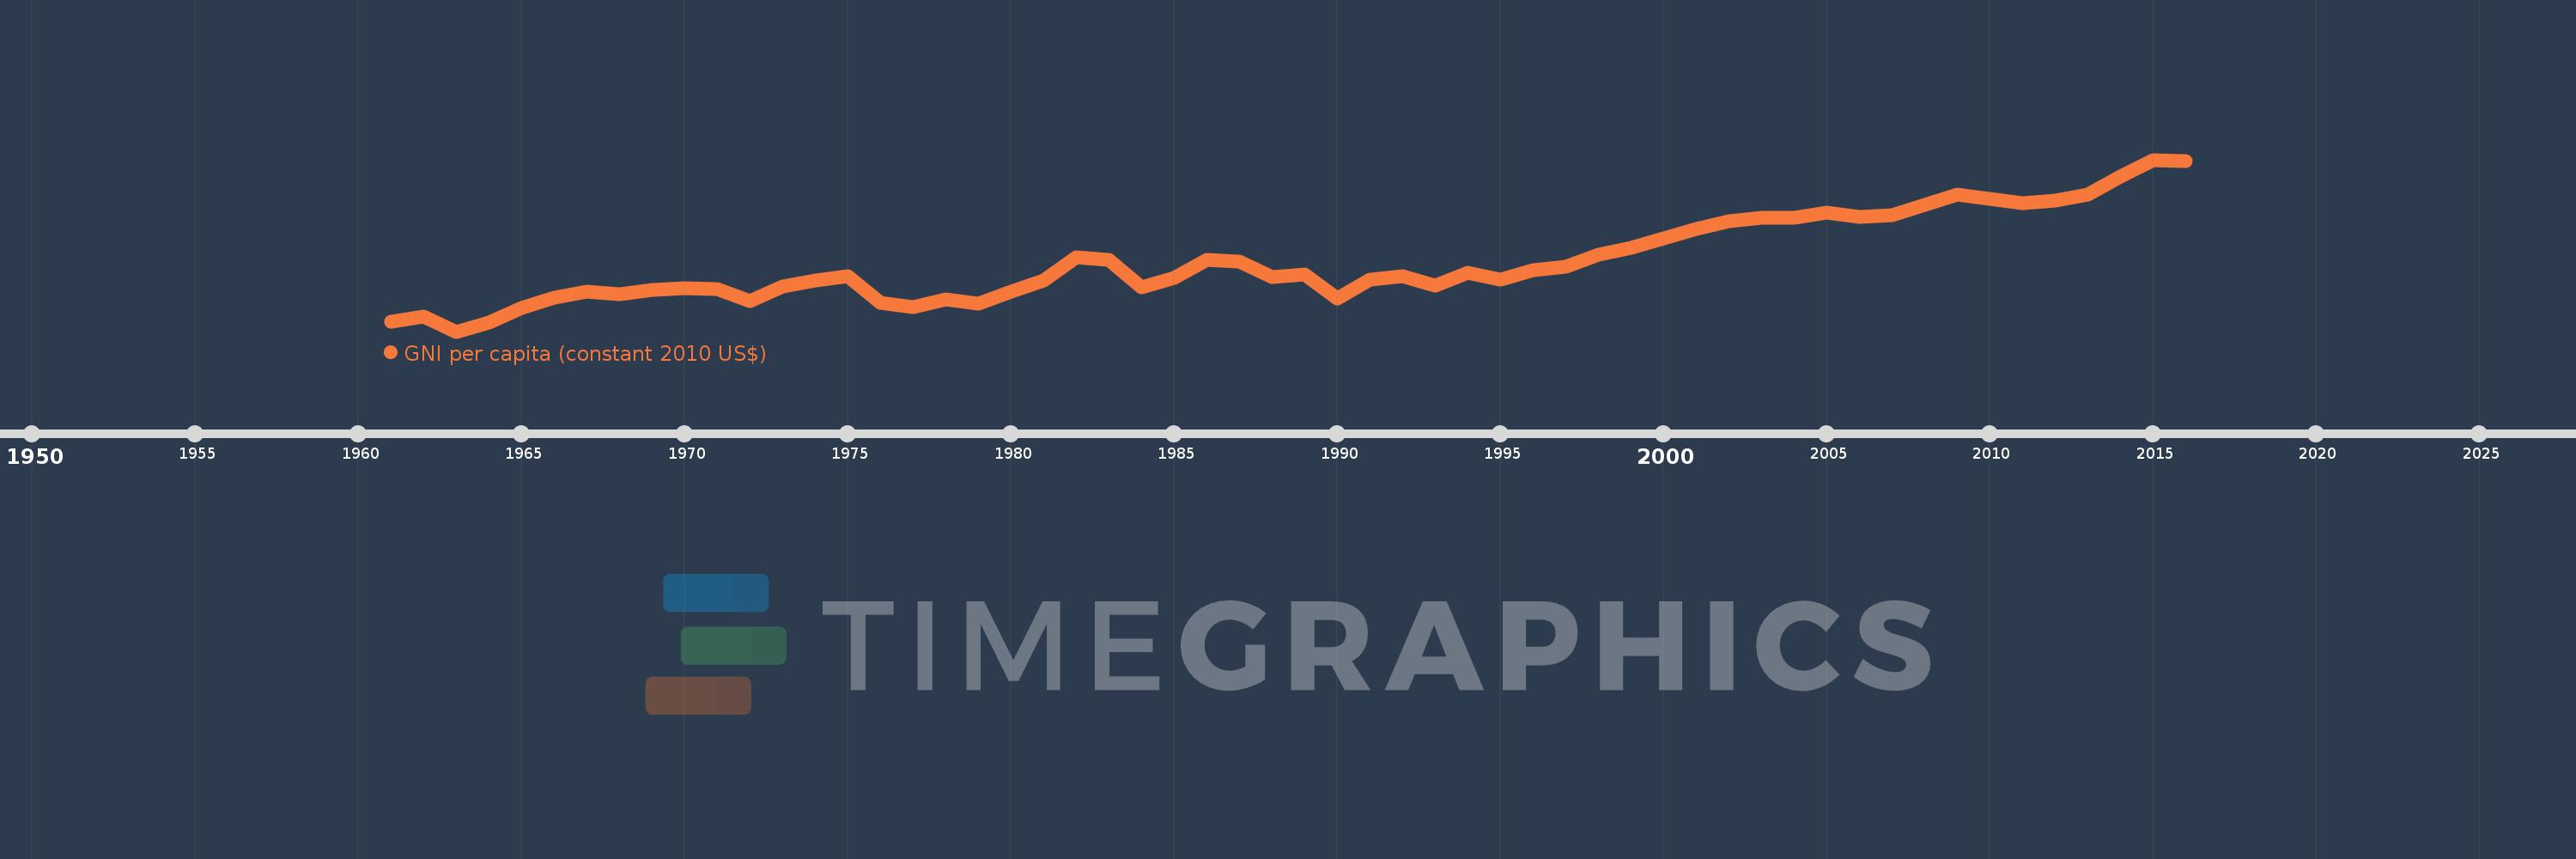
GNI per capita (constant 2010 US$)
2016,2015,2014,2013,2012,2011,2010,2009,2008,2007,2006,2005,2004,2003,2002,2001,2000,1999,1998,1997,1996,1995,1994,1993,1992,1991,1990,1989,1988,1987,1986,1985,1984,1983,1982,1981,1980,1979,1978,1977,1976,1975,1974,1973,1972,1971,1970,1969,1968,1967,1966,1965,1964,1963,1962,1961
This statistics in other country:
AfghanistanAlbaniaAlgeriaAndorraAngolaAntigua and BarbudaArab WorldArgentinaArmeniaAustraliaAustriaAzerbaijanBahamas, TheBahrainBangladeshBarbadosBelarusBelgiumBelizeBeninBermudaBhutanBoliviaBosnia and HerzegovinaBotswanaBrazilBrunei DarussalamBulgariaBurkina FasoBurundiCabo VerdeCambodiaCameroonCanadaCaribbean small statesCentral African RepublicCentral Europe and the BalticsChadChileChinaColombiaComorosCongo, Dem. Rep.Congo, Rep.Costa RicaCote d'IvoireCroatiaCubaCyprusCzech RepublicDenmarkDominicaDominican RepublicEarly-demographic dividendEast Asia & PacificEast Asia & Pacific (excluding high income)East Asia & Pacific (IDA & IBRD countries)EcuadorEgypt, Arab Rep.El SalvadorEquatorial GuineaEritreaEstoniaEthiopiaEuro areaEurope & Central AsiaEurope & Central Asia (excluding high income)Europe & Central Asia (IDA & IBRD countries)European UnionFaroe IslandsFijiFinlandFragile and conflict affected situationsFranceGabonGambia, TheGeorgiaGermanyGhanaGreeceGrenadaGuatemalaGuineaGuinea-BissauGuyanaHaitiHeavily indebted poor countries (HIPC)High incomeHondurasHong Kong SAR, ChinaHungaryIBRD onlyIcelandIDA & IBRD totalIDA blendIDA onlyIDA totalIndiaIndonesiaIran, Islamic Rep.IraqIrelandIsle of ManIsraelItalyJamaicaJapanJordanKazakhstanKenyaKiribatiKorea, Rep.KosovoKuwaitKyrgyz RepublicLao PDRLate-demographic dividendLatin America & Caribbean Latin America & Caribbean (excluding high income)Latin America & the Caribbean (IDA & IBRD countries)LatviaLeast developed countries: UN classificationLebanonLesothoLiberiaLibyaLiechtensteinLithuaniaLow & middle incomeLow incomeLower middle incomeLuxembourgMacao SAR, ChinaMacedonia, FYRMadagascarMalawiMalaysiaMaldivesMaliMaltaMarshall IslandsMauritaniaMauritiusMexicoMicronesia, Fed. Sts.Middle East & North AfricaMiddle East & North Africa (excluding high income)Middle East & North Africa (IDA & IBRD countries)Middle incomeMoldovaMongoliaMontenegroMoroccoMozambiqueMyanmarNamibiaNauruNepalNetherlandsNew ZealandNicaraguaNigerNigeriaNorth AmericaNorwayOECD membersOmanOther small statesPacific island small statesPakistanPalauPanamaPapua New GuineaParaguayPeruPhilippinesPolandPortugalPost-demographic dividendPre-demographic dividendPuerto RicoQatarRomaniaRussian FederationRwandaSamoaSao Tome and PrincipeSaudi ArabiaSenegalSerbiaSeychellesSierra LeoneSingaporeSlovak RepublicSloveniaSmall statesSolomon IslandsSouth AfricaSouth AsiaSouth Asia (IDA & IBRD)South SudanSpainSri LankaSt. Kitts and NevisSt. LuciaSt. Vincent and the GrenadinesSub-Saharan Africa Sub-Saharan Africa (excluding high income)Sub-Saharan Africa (IDA & IBRD countries)SudanSurinameSwazilandSwedenSwitzerlandTajikistanTanzaniaThailandTimor-LesteTogoTongaTrinidad and TobagoTunisiaTurkeyTurkmenistanTuvaluUgandaUkraineUnited Arab EmiratesUnited KingdomUnited StatesUpper middle incomeUruguayUzbekistanVanuatuVenezuela, RBVietnamWest Bank and GazaWorldYemen, Rep.ZambiaZimbabwe Timeline:
This timeline shows a graph from 1961 to 2016 of Benin. No data until 1960. Number of actual observations by date: 56.
Source name:
World Development Indicators
Source organization:
World Bank national accounts data, and OECD National Accounts data files.
Categories, topics:
Economy & Growth
Last updated:
apr 23, 2017
Indicators value changes by year
Minimum:
501.972
jan 1, 1963
Maximum:
803.886
jan 1, 2015
At the date of observation
Value
Absolute change
Change from previous value
jan 1, 1961
518.741
+518.741
0.0%
jan 1, 1962
527.635
+8.895
1.71%
jan 1, 1963
501.972
-25.663
-4.86%
jan 1, 1964
517.474
+15.502
3.09%
jan 1, 1965
542.765
+25.291
4.89%
jan 1, 1966
561.557
+18.792
3.46%
jan 1, 1967
572.48
+10.922
1.95%
jan 1, 1968
567.01
-5.469
-0.96%
jan 1, 1969
575.187
+8.177
1.44%
jan 1, 1970
577.54
+2.353
0.41%
jan 1, 1971
577.255
-0.285
-0.05%
jan 1, 1972
555.054
-22.201
-3.85%
jan 1, 1973
580.505
+25.451
4.59%
jan 1, 1974
591.804
+11.299
1.95%
jan 1, 1975
600.027
+8.224
1.39%
jan 1, 1976
553.188
-46.839
-7.81%
jan 1, 1977
545.479
-7.709
-1.39%
jan 1, 1978
558.024
+12.544
2.3%
jan 1, 1979
550.794
-7.23
-1.3%
jan 1, 1980
571.805
+21.011
3.81%
jan 1, 1981
592.115
+20.31
3.55%
jan 1, 1982
633.097
+40.982
6.92%
jan 1, 1983
627.786
-5.311
-0.84%
jan 1, 1984
579.004
-48.782
-7.77%
jan 1, 1985
596.451
+17.446
3.01%
jan 1, 1986
628.425
+31.974
5.36%
jan 1, 1987
624.7
-3.725
-0.59%
jan 1, 1988
598.35
-26.35
-4.22%
jan 1, 1989
602.207
+3.856
0.64%
jan 1, 1990
560.827
-41.38
-6.87%
jan 1, 1991
594.01
+33.183
5.92%
jan 1, 1992
600.066
+6.056
1.02%
jan 1, 1993
582.079
-17.987
-3.0%
jan 1, 1994
605.668
+23.589
4.05%
jan 1, 1995
593.517
-12.151
-2.01%
jan 1, 1996
609.505
+15.988
2.69%
jan 1, 1997
616.563
+7.058
1.16%
jan 1, 1998
637.341
+20.778
3.37%
jan 1, 1999
649.234
+11.892
1.87%
jan 1, 2000
665.125
+15.891
2.45%
jan 1, 2001
682.765
+17.641
2.65%
jan 1, 2002
696.111
+13.346
1.95%
jan 1, 2003
702.134
+6.023
0.87%
jan 1, 2004
702.073
-0.06
-0.01%
jan 1, 2005
710.468
+8.394
1.2%
jan 1, 2006
702.978
-7.489
-1.05%
jan 1, 2007
706.565
+3.587
0.51%
jan 1, 2008
724.528
+17.963
2.54%
jan 1, 2009
742.313
+17.784
2.45%
jan 1, 2010
735.223
-7.089
-0.96%
jan 1, 2011
727.33
-7.894
-1.07%
jan 1, 2012
732.47
+5.141
0.71%
jan 1, 2013
742.264
+9.794
1.34%
jan 1, 2014
775.066
+32.802
4.42%
jan 1, 2015
803.886
+28.82
3.72%
jan 1, 2016
802.076
-1.809
-0.23%
Ranking of countries by current statistics by years


Comments: