29
/
en
AIzaSyAYiBZKx7MnpbEhh9jyipgxe19OcubqV5w
April 1, 2024
62464
World
WLD
false
2
1
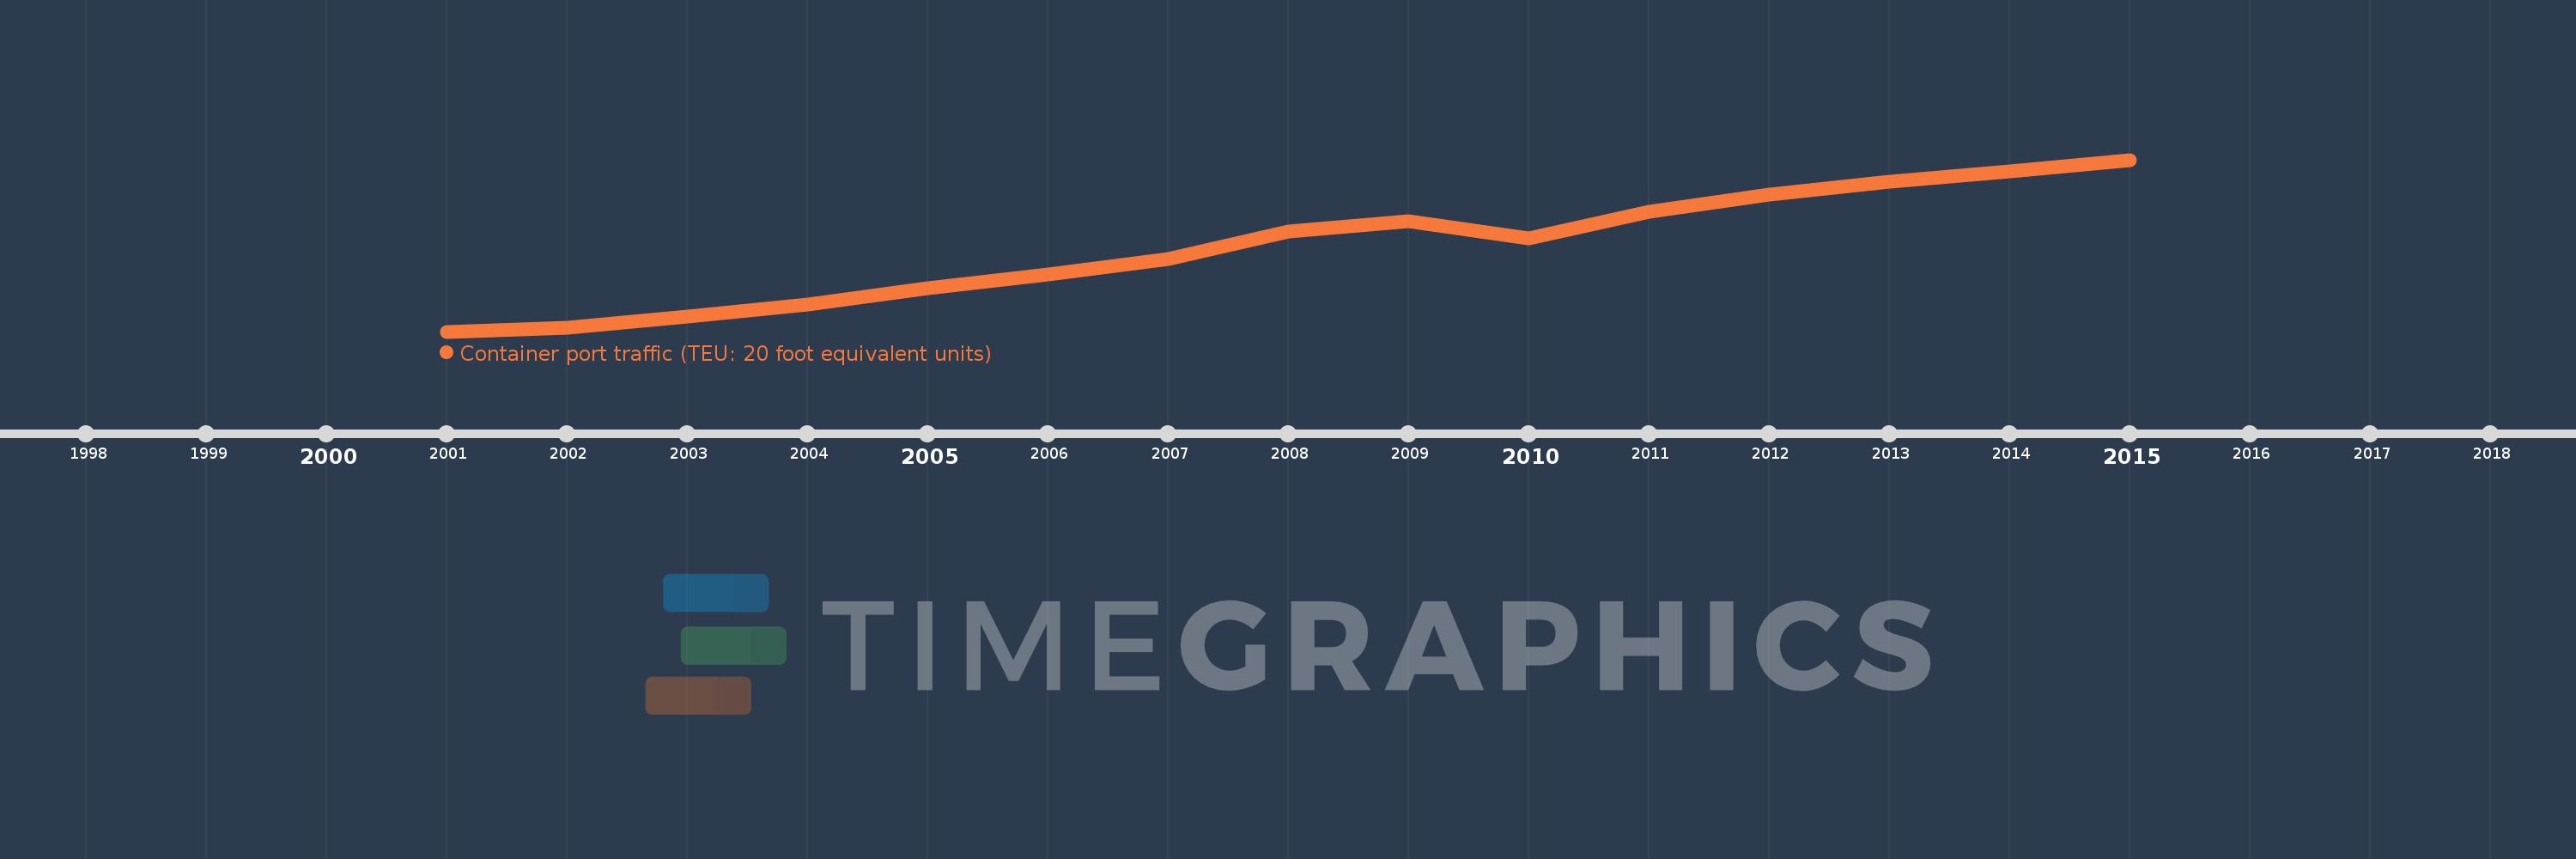
Container port traffic (TEU: 20 foot equivalent units)
2015,2014,2013,2012,2011,2010,2009,2008,2007,2006,2005,2004,2003,2002,2001
This statistics in other country:
Timeline:
This timeline shows a graph from 2001 to 2015 of World. No data until 2000. Number of actual observations by date: 15.
Source name:
World Development Indicators
Source organization:
Containerisation International, Containerisation International Yearbook.
Categories, topics:
Infrastructure
Last updated:
apr 23, 2017
Indicators value changes by year
Minimum:
224.775 mln
jan 1, 2001
Maximum:
679.265 mln
jan 1, 2015
At the date of observation
Value
Absolute change
Change from previous value
jan 1, 2001
224.775 mln
+224.775 mln
0.0%
jan 1, 2002
235.075 mln
+10.301 mln
4.58%
jan 1, 2003
263.457 mln
+28.381 mln
12.07%
jan 1, 2004
296.996 mln
+33.54 mln
12.73%
jan 1, 2005
338.434 mln
+41.438 mln
13.95%
jan 1, 2006
376.268 mln
+37.834 mln
11.18%
jan 1, 2007
416.752 mln
+40.484 mln
10.76%
jan 1, 2008
489.818 mln
+73.066 mln
17.53%
jan 1, 2009
516.152 mln
+26.334 mln
5.38%
jan 1, 2010
472.175 mln
-43.977 mln
-8.52%
jan 1, 2011
542.248 mln
+70.073 mln
14.84%
jan 1, 2012
587.483 mln
+45.235 mln
8.34%
jan 1, 2013
622.314 mln
+34.83 mln
5.93%
jan 1, 2014
649.454 mln
+27.14 mln
4.36%
jan 1, 2015
679.265 mln
+29.811 mln
4.59%
Ranking of countries by current statistics by years


Comments: