29
/
en
AIzaSyAYiBZKx7MnpbEhh9jyipgxe19OcubqV5w
April 1, 2024
207769
Netherlands
NLD
true
2
1
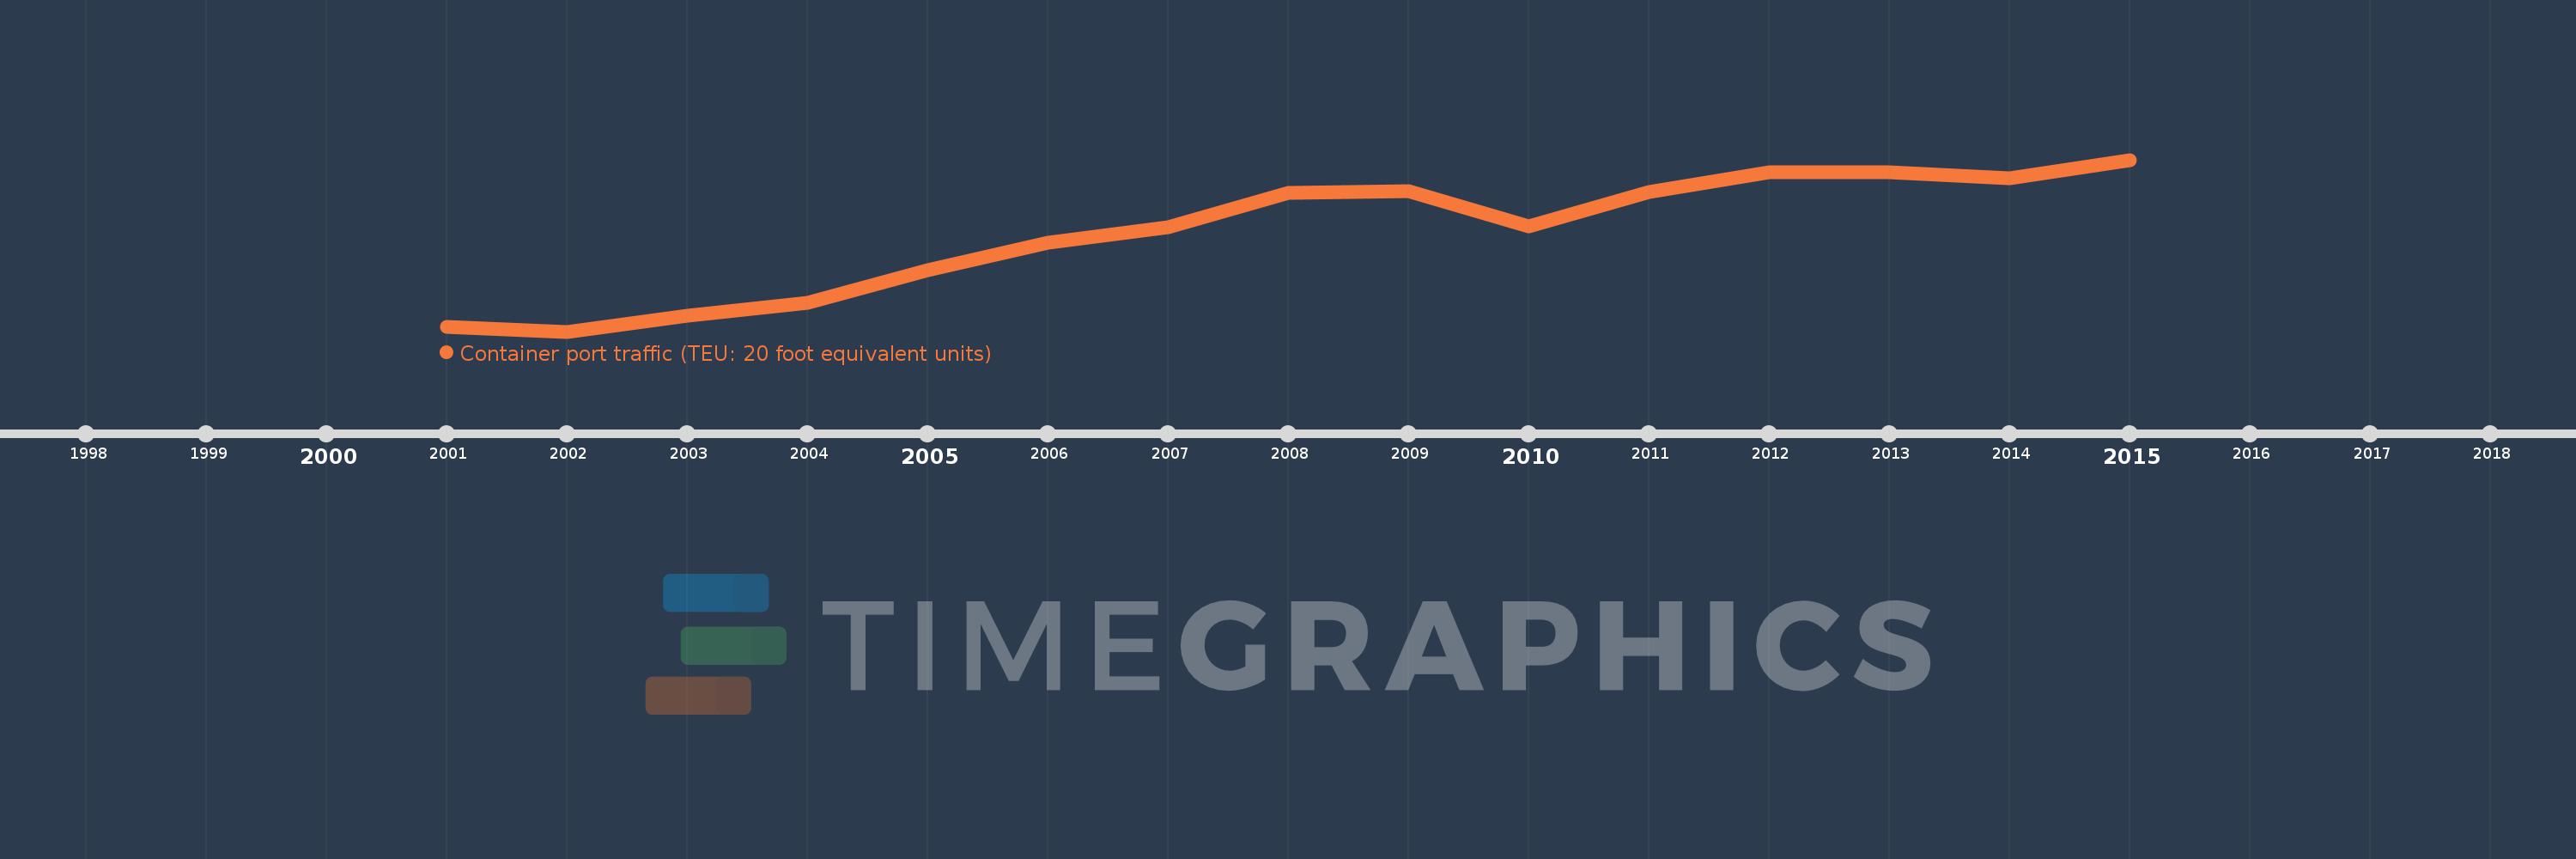
Container port traffic (TEU: 20 foot equivalent units)
2015,2014,2013,2012,2011,2010,2009,2008,2007,2006,2005,2004,2003,2002,2001
This statistics in other country:
Timeline:
This timeline shows a graph from 2001 to 2015 of Netherlands. No data until 2000. Number of actual observations by date: 15.
Source name:
World Development Indicators
Source organization:
Containerisation International, Containerisation International Yearbook.
Categories, topics:
Infrastructure
Last updated:
apr 23, 2017
Indicators value changes by year
Minimum:
6.227 mln
jan 1, 2002
Maximum:
12.513 mln
jan 1, 2015
At the date of observation
Value
Absolute change
Change from previous value
jan 1, 2001
6.407 mln
+6.407 mln
0.0%
jan 1, 2002
6.227 mln
-179.841K
-2.81%
jan 1, 2003
6.798 mln
+570.209K
9.16%
jan 1, 2004
7.294 mln
+496.26K
7.3%
jan 1, 2005
8.482 mln
+1.188 mln
16.29%
jan 1, 2006
9.472 mln
+989.639K
11.67%
jan 1, 2007
10.047 mln
+574.674K
6.07%
jan 1, 2008
11.29 mln
+1.244 mln
12.38%
jan 1, 2009
11.362 mln
+71.829K
0.64%
jan 1, 2010
10.066 mln
-1.296 mln
-11.4%
jan 1, 2011
11.345 mln
+1.279 mln
12.7%
jan 1, 2012
12.073 mln
+727.529K
6.41%
jan 1, 2013
12.068 mln
-4.927K
-0.04%
jan 1, 2014
11.829 mln
-238.96K
-1.98%
jan 1, 2015
12.513 mln
+684.598K
5.79%
Ranking of countries by current statistics by years


Comments: