29
/
en
AIzaSyAYiBZKx7MnpbEhh9jyipgxe19OcubqV5w
April 1, 2024
30538
Europe & Central Asia
ECS
false
2
1
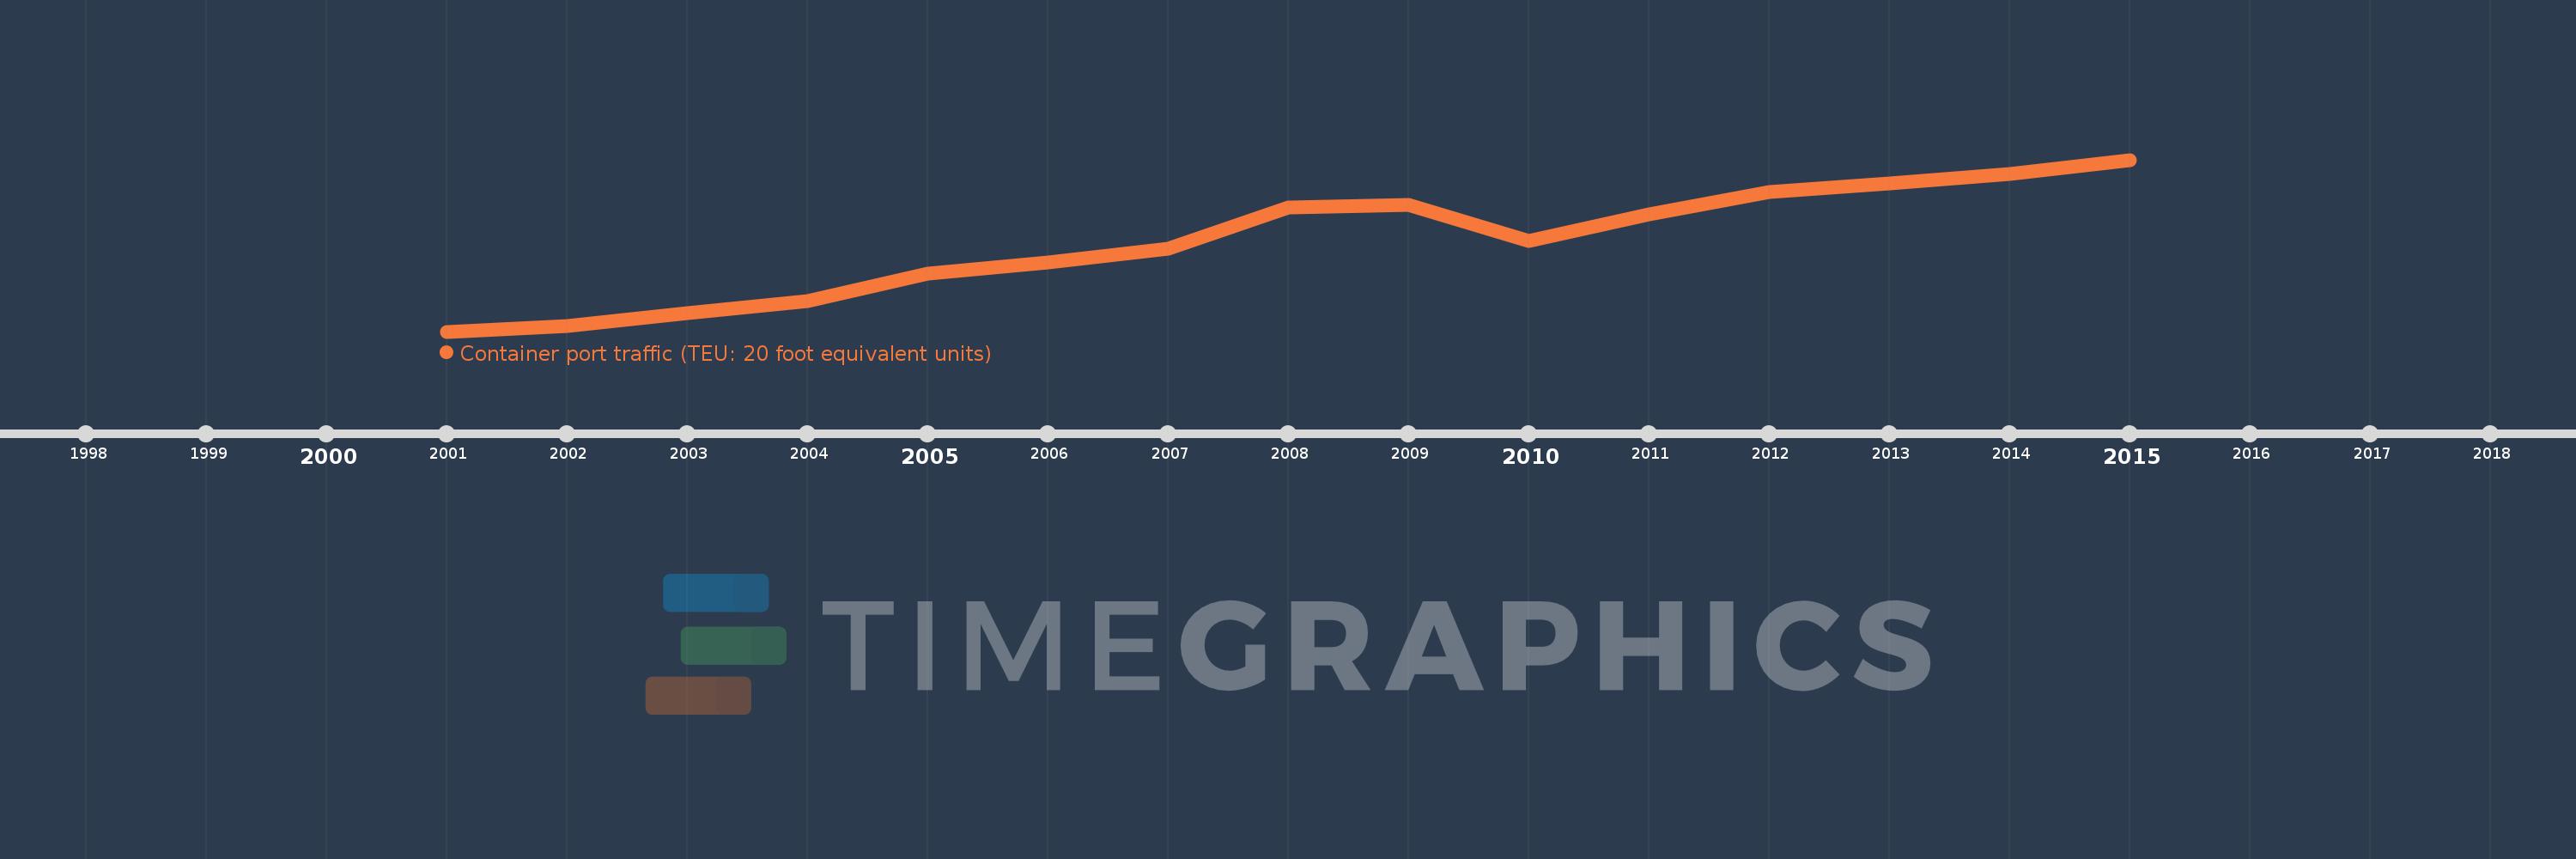
Container port traffic (TEU: 20 foot equivalent units)
2015,2014,2013,2012,2011,2010,2009,2008,2007,2006,2005,2004,2003,2002,2001
This statistics in other country:
Timeline:
This timeline shows a graph from 2001 to 2015 of Europe & Central Asia. No data until 2000. Number of actual observations by date: 15.
Source name:
World Development Indicators
Source organization:
Containerisation International, Containerisation International Yearbook.
Categories, topics:
Infrastructure
Last updated:
apr 23, 2017
Indicators value changes by year
Minimum:
48.312 mln
jan 1, 2001
Maximum:
116.401 mln
jan 1, 2015
At the date of observation
Value
Absolute change
Change from previous value
jan 1, 2001
48.312 mln
+48.312 mln
0.0%
jan 1, 2002
50.66 mln
+2.348 mln
4.86%
jan 1, 2003
55.629 mln
+4.969 mln
9.81%
jan 1, 2004
60.322 mln
+4.693 mln
8.44%
jan 1, 2005
71.19 mln
+10.868 mln
18.02%
jan 1, 2006
75.798 mln
+4.608 mln
6.47%
jan 1, 2007
81.292 mln
+5.493 mln
7.25%
jan 1, 2008
97.542 mln
+16.251 mln
19.99%
jan 1, 2009
98.52 mln
+978.046K
1.0%
jan 1, 2010
84.176 mln
-14.344 mln
-14.56%
jan 1, 2011
94.758 mln
+10.582 mln
12.57%
jan 1, 2012
103.744 mln
+8.985 mln
9.48%
jan 1, 2013
107.175 mln
+3.431 mln
3.31%
jan 1, 2014
110.881 mln
+3.706 mln
3.46%
jan 1, 2015
116.401 mln
+5.52 mln
4.98%
Ranking of countries by current statistics by years


Comments: