29
/
en
AIzaSyAYiBZKx7MnpbEhh9jyipgxe19OcubqV5w
April 1, 2024
101761
Cayman Islands
CYM
true
2
1
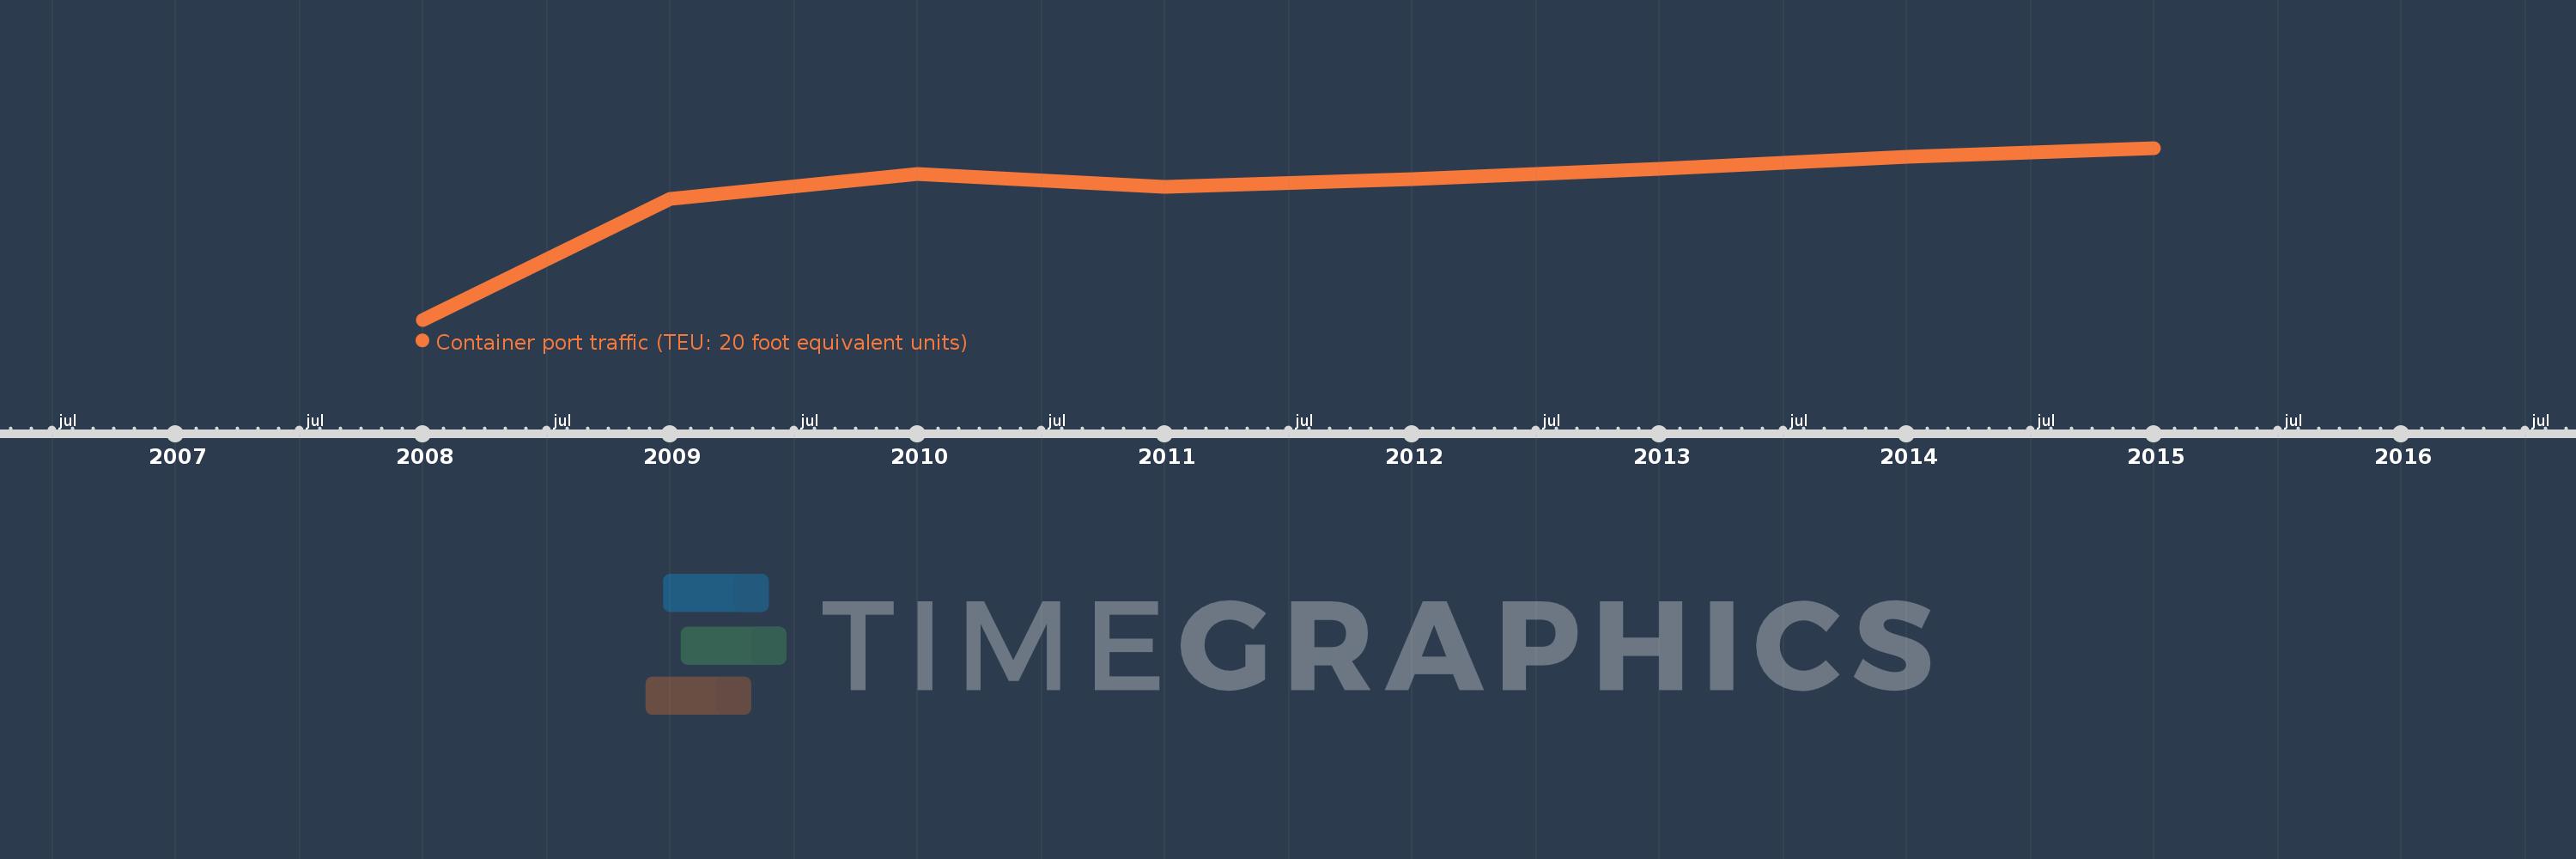
Container port traffic (TEU: 20 foot equivalent units)
2015,2014,2013,2012,2011,2010,2009,2008
This statistics in other country:
Timeline:
This timeline shows a graph from 2008 to 2015 of Cayman Islands. No data until 2007. Number of actual observations by date: 8.
Source name:
World Development Indicators
Source organization:
Containerisation International, Containerisation International Yearbook.
Categories, topics:
Infrastructure
Last updated:
apr 23, 2017
Indicators value changes by year
Maximum:
51.905K
jan 1, 2015
At the date of observation
Value
Absolute change
Change from previous value
jan 1, 2008
649.0
+649.0
0.0%
jan 1, 2009
36.644K
+35.995K
5.55K%
jan 1, 2010
44.215K
+7.571K
20.66%
jan 1, 2011
40.281K
-3.934K
-8.9%
jan 1, 2012
42.577K
+2.296K
5.7%
jan 1, 2013
45.77K
+3.193K
7.5%
jan 1, 2014
49.386K
+3.616K
7.9%
jan 1, 2015
51.905K
+2.519K
5.1%
Ranking of countries by current statistics by years


Comments: