29
/
en
AIzaSyAYiBZKx7MnpbEhh9jyipgxe19OcubqV5w
April 1, 2024
115657
Cuba
CUB
true
2
1
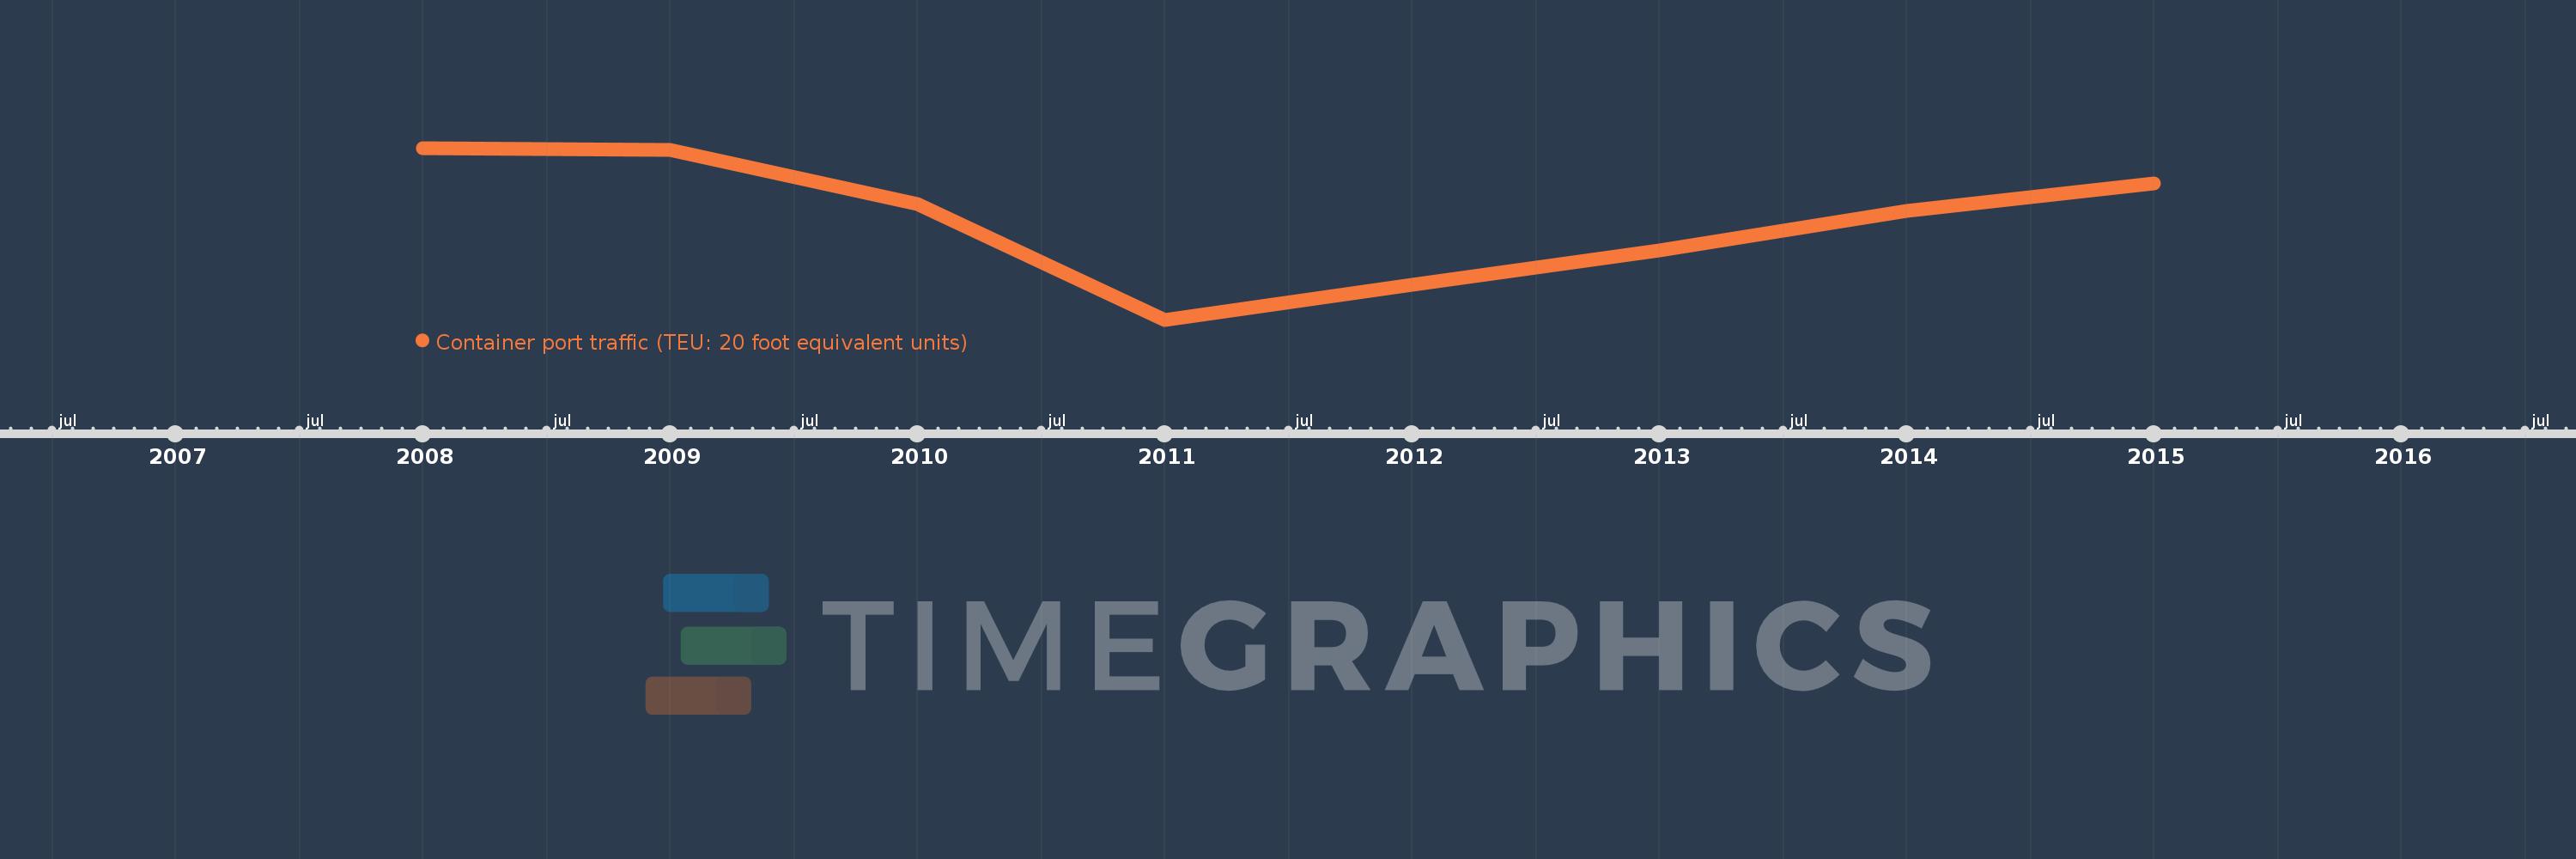
Container port traffic (TEU: 20 foot equivalent units)
2015,2014,2013,2012,2011,2010,2009,2008
This statistics in other country:
Timeline:
This timeline shows a graph from 2008 to 2015 of Cuba. No data until 2007. Number of actual observations by date: 8.
Source name:
World Development Indicators
Source organization:
Containerisation International, Containerisation International Yearbook.
Categories, topics:
Infrastructure
Last updated:
apr 23, 2017
Indicators value changes by year
Minimum:
228.346K
jan 1, 2011
Maximum:
319.857K
jan 1, 2008
At the date of observation
Value
Absolute change
Change from previous value
jan 1, 2008
319.857K
+319.857K
0.0%
jan 1, 2009
319.0K
-857.0
-0.27%
jan 1, 2010
290.099K
-28.901K
-9.06%
jan 1, 2011
228.346K
-61.753K
-21.29%
jan 1, 2012
246.773K
+18.427K
8.07%
jan 1, 2013
265.281K
+18.508K
7.5%
jan 1, 2014
286.238K
+20.957K
7.9%
jan 1, 2015
300.836K
+14.598K
5.1%
Ranking of countries by current statistics by years


Comments: