29
/
en
AIzaSyAYiBZKx7MnpbEhh9jyipgxe19OcubqV5w
April 1, 2024
240294
Singapore
SGP
true
2
1
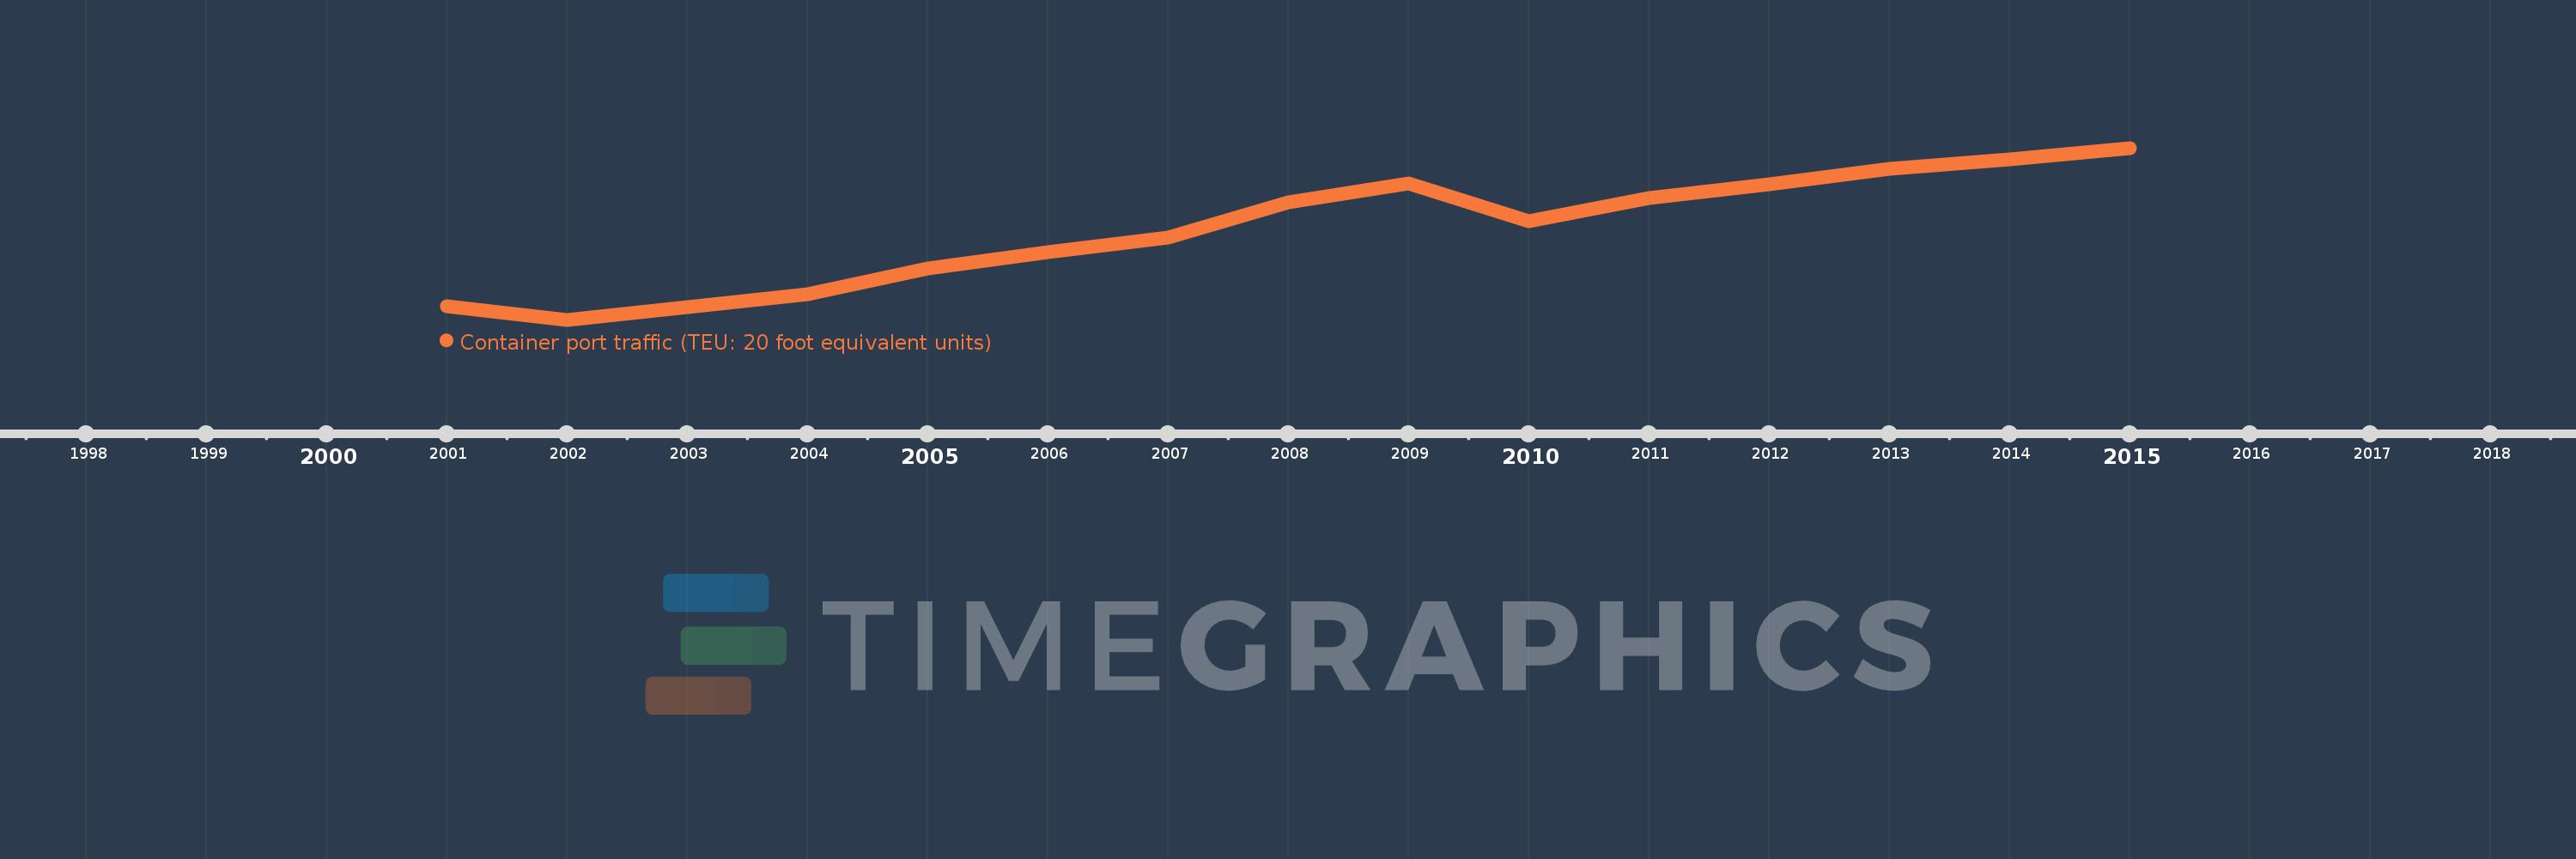
Container port traffic (TEU: 20 foot equivalent units)
2015,2014,2013,2012,2011,2010,2009,2008,2007,2006,2005,2004,2003,2002,2001
This statistics in other country:
Timeline:
This timeline shows a graph from 2001 to 2015 of Singapore. No data until 2000. Number of actual observations by date: 15.
Source name:
World Development Indicators
Source organization:
Containerisation International, Containerisation International Yearbook.
Categories, topics:
Infrastructure
Last updated:
apr 23, 2017
Indicators value changes by year
Minimum:
15.573 mln
jan 1, 2002
Maximum:
34.832 mln
jan 1, 2015
At the date of observation
Value
Absolute change
Change from previous value
jan 1, 2001
17.1 mln
+17.1 mln
0.0%
jan 1, 2002
15.573 mln
-1.527 mln
-8.93%
jan 1, 2003
16.986 mln
+1.413 mln
9.08%
jan 1, 2004
18.441 mln
+1.455 mln
8.57%
jan 1, 2005
21.329 mln
+2.888 mln
15.66%
jan 1, 2006
23.192 mln
+1.863 mln
8.74%
jan 1, 2007
24.792 mln
+1.6 mln
6.9%
jan 1, 2008
28.767 mln
+3.975 mln
16.03%
jan 1, 2009
30.891 mln
+2.124 mln
7.38%
jan 1, 2010
26.593 mln
-4.298 mln
-13.91%
jan 1, 2011
29.178 mln
+2.586 mln
9.72%
jan 1, 2012
30.728 mln
+1.549 mln
5.31%
jan 1, 2013
32.499 mln
+1.771 mln
5.76%
jan 1, 2014
33.516 mln
+1.018 mln
3.13%
jan 1, 2015
34.832 mln
+1.316 mln
3.93%
Ranking of countries by current statistics by years


Comments: