29
/
en
AIzaSyAYiBZKx7MnpbEhh9jyipgxe19OcubqV5w
April 1, 2024
124607
Egypt, Arab Rep.
EGY
true
2
1
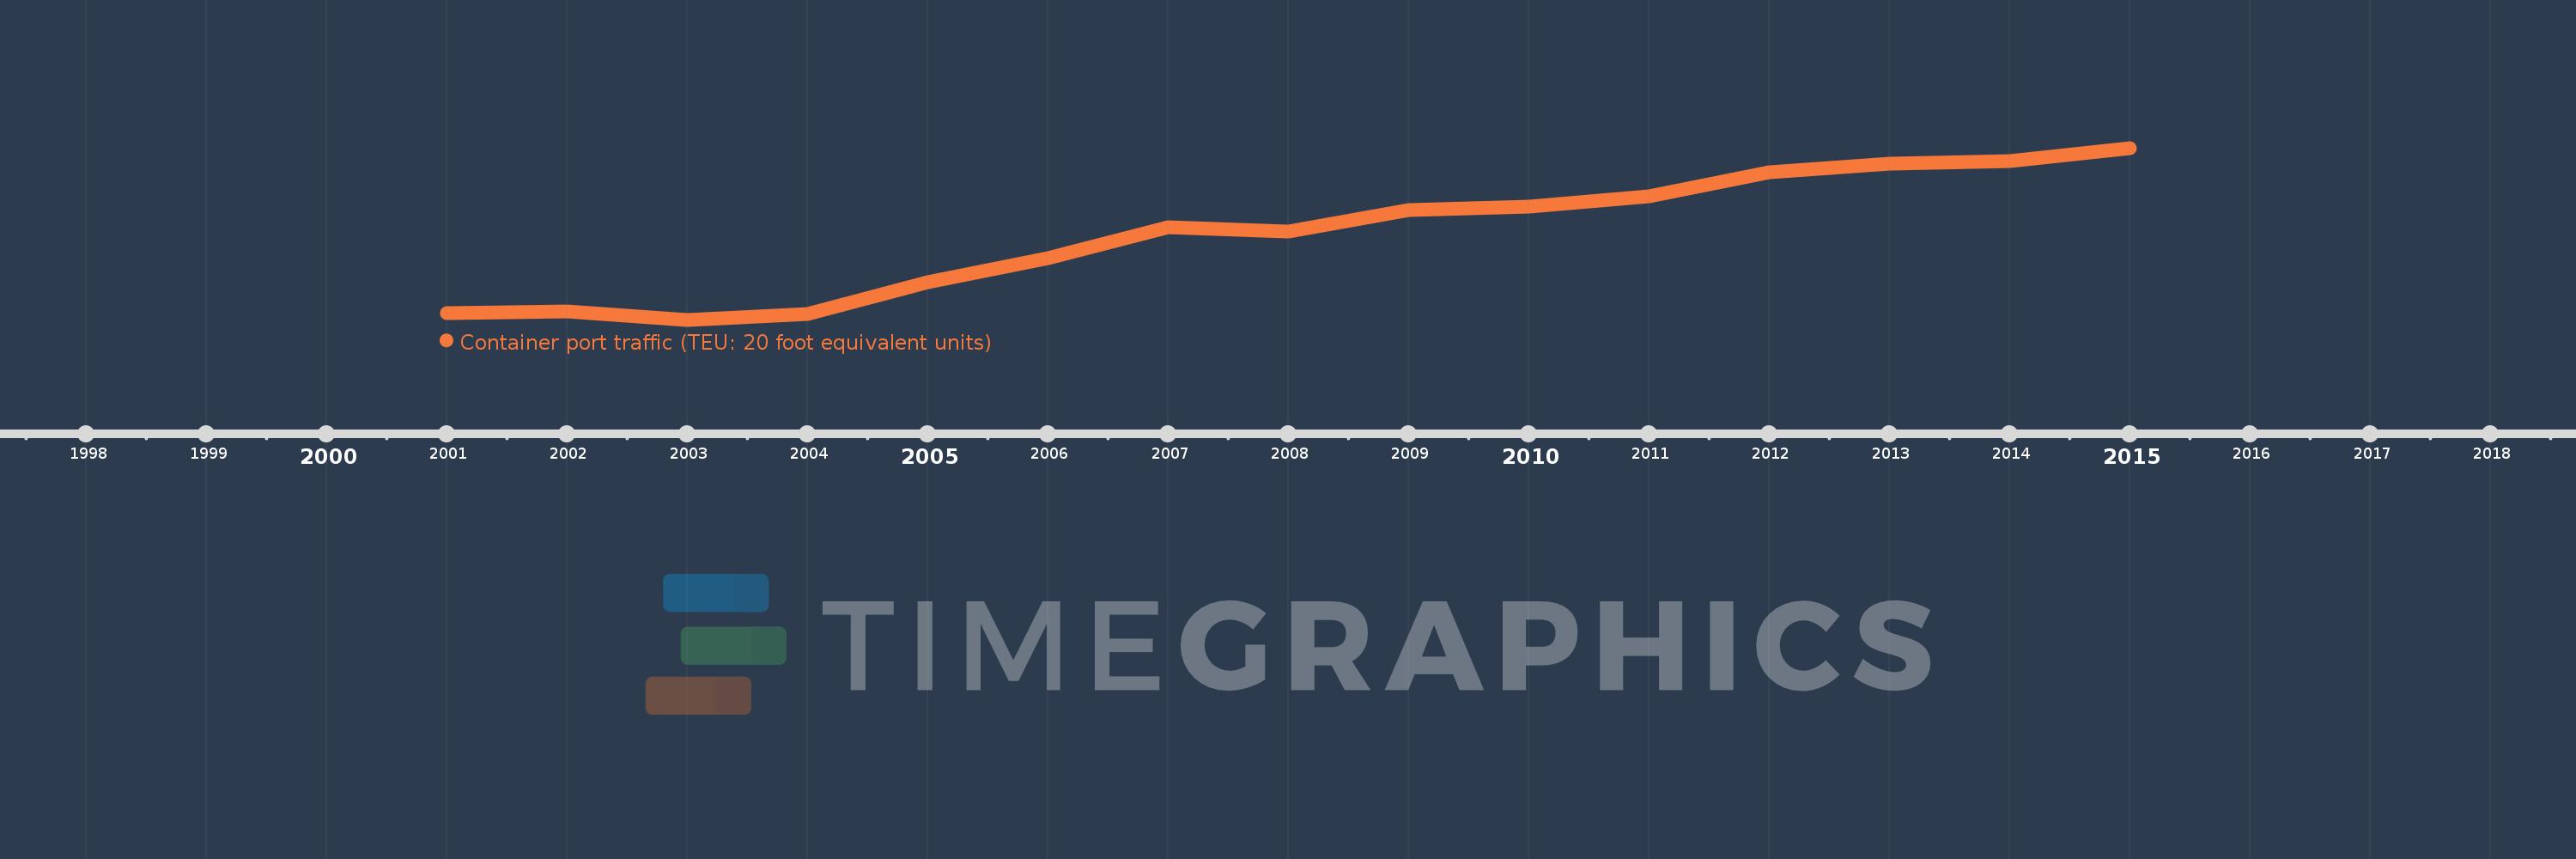
Container port traffic (TEU: 20 foot equivalent units)
2015,2014,2013,2012,2011,2010,2009,2008,2007,2006,2005,2004,2003,2002,2001
This statistics in other country:
Timeline:
This timeline shows a graph from 2001 to 2015 of Egypt, Arab Rep.. No data until 2000. Number of actual observations by date: 15.
Source name:
World Development Indicators
Source organization:
Containerisation International, Containerisation International Yearbook.
Categories, topics:
Infrastructure
Last updated:
apr 23, 2017
Indicators value changes by year
Minimum:
1.336 mln
jan 1, 2003
Maximum:
8.811 mln
jan 1, 2015
At the date of observation
Value
Absolute change
Change from previous value
jan 1, 2001
1.626 mln
+1.626 mln
0.0%
jan 1, 2002
1.709 mln
+83.389K
5.13%
jan 1, 2003
1.336 mln
-372.95K
-21.82%
jan 1, 2004
1.58 mln
+243.49K
18.22%
jan 1, 2005
2.96 mln
+1.38 mln
87.39%
jan 1, 2006
4.031 mln
+1.071 mln
36.19%
jan 1, 2007
5.373 mln
+1.342 mln
33.28%
jan 1, 2008
5.182 mln
-191.251K
-3.56%
jan 1, 2009
6.099 mln
+917.637K
17.71%
jan 1, 2010
6.25 mln
+151.225K
2.48%
jan 1, 2011
6.709 mln
+458.61K
7.34%
jan 1, 2012
7.737 mln
+1.028 mln
15.32%
jan 1, 2013
8.141 mln
+403.767K
5.22%
jan 1, 2014
8.248 mln
+107.165K
1.32%
jan 1, 2015
8.811 mln
+562.875K
6.82%
Ranking of countries by current statistics by years


Comments: