29
/
en
AIzaSyAYiBZKx7MnpbEhh9jyipgxe19OcubqV5w
April 1, 2024
203958
Myanmar
MMR
true
2
1
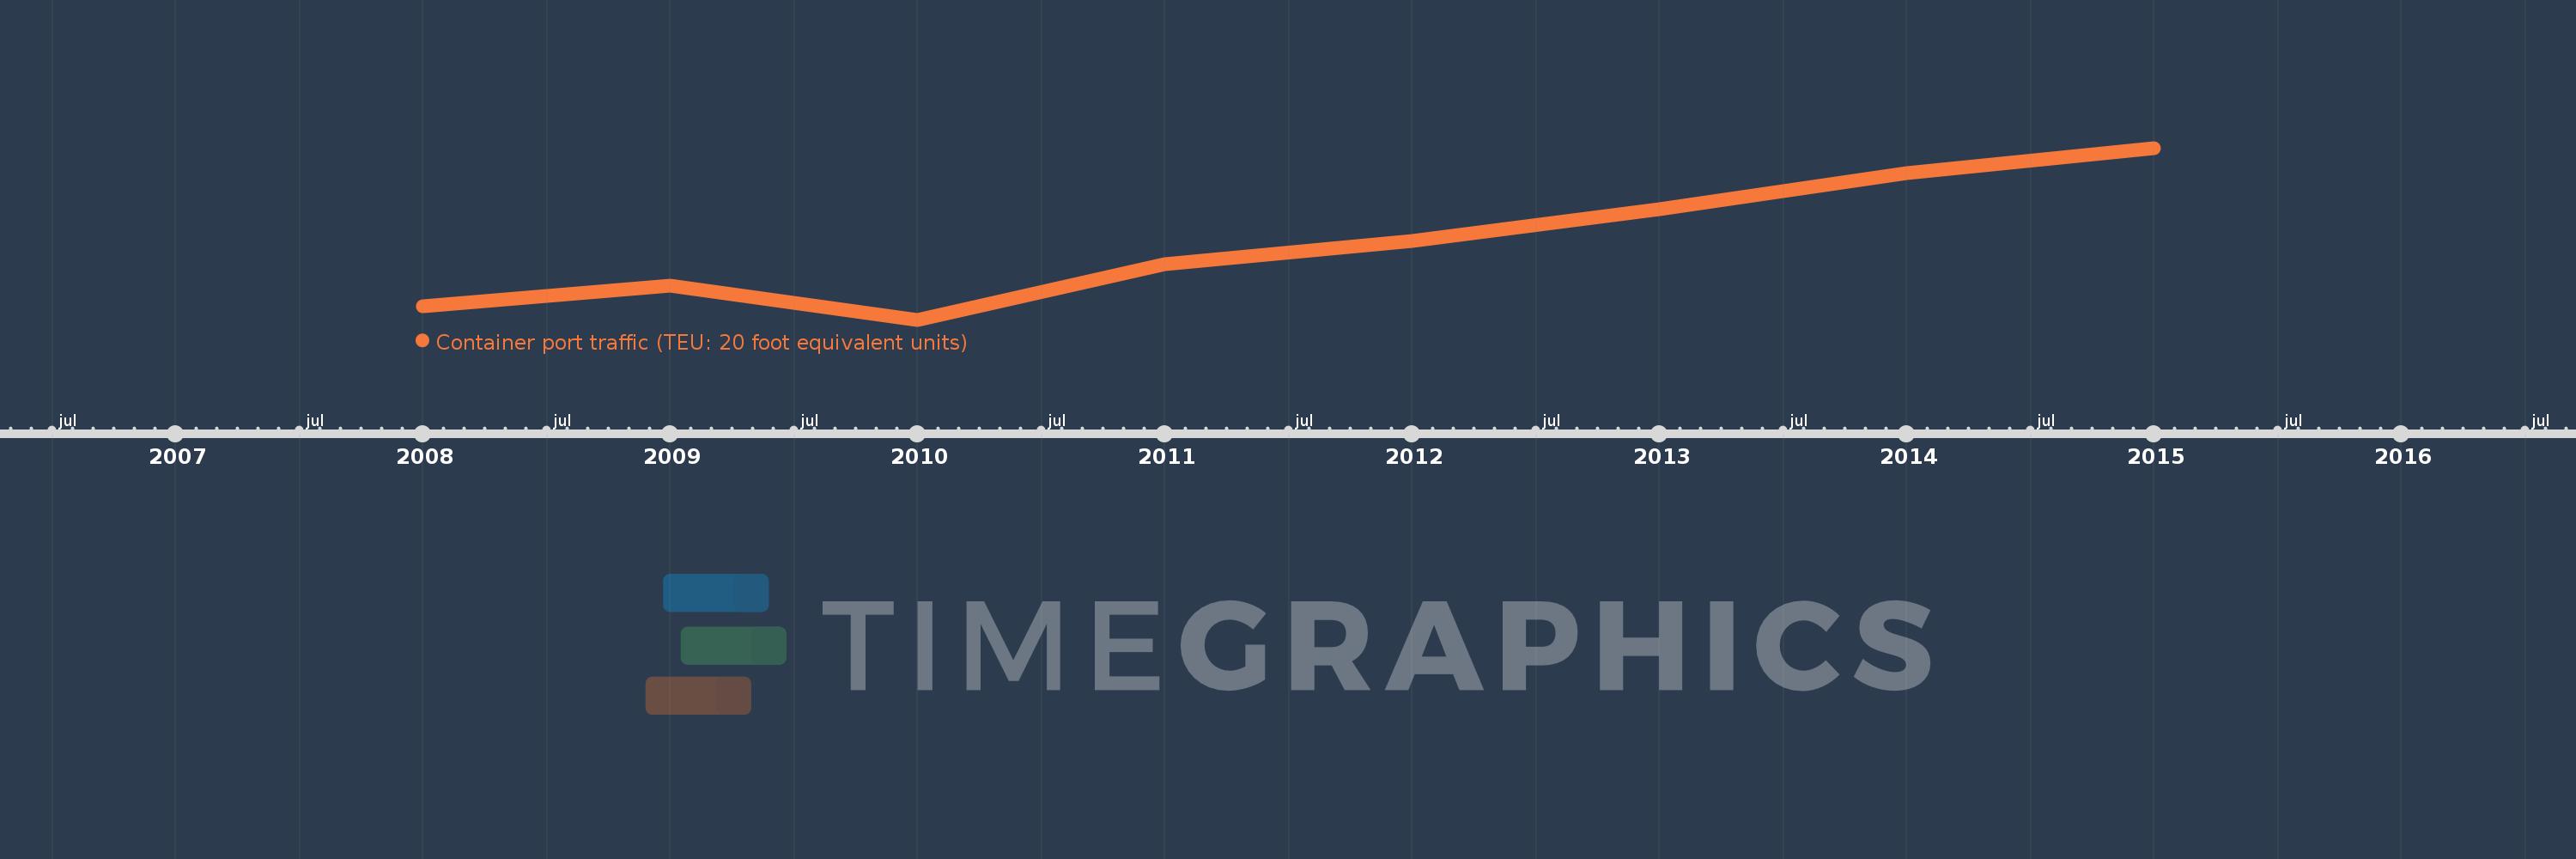
Container port traffic (TEU: 20 foot equivalent units)
2015,2014,2013,2012,2011,2010,2009,2008
This statistics in other country:
Timeline:
This timeline shows a graph from 2008 to 2015 of Myanmar. No data until 2007. Number of actual observations by date: 8.
Source name:
World Development Indicators
Source organization:
Containerisation International, Containerisation International Yearbook.
Categories, topics:
Infrastructure
Last updated:
apr 23, 2017
Indicators value changes by year
Minimum:
163.692K
jan 1, 2010
Maximum:
244.888K
jan 1, 2015
At the date of observation
Value
Absolute change
Change from previous value
jan 1, 2008
170.0K
+170.0K
0.0%
jan 1, 2009
180.0K
+10.0K
5.88%
jan 1, 2010
163.692K
-16.308K
-9.06%
jan 1, 2011
190.046K
+26.354K
16.1%
jan 1, 2012
200.879K
+10.833K
5.7%
jan 1, 2013
215.945K
+15.066K
7.5%
jan 1, 2014
233.005K
+17.06K
7.9%
jan 1, 2015
244.888K
+11.883K
5.1%
Ranking of countries by current statistics by years


Comments: