29
/
en
AIzaSyAYiBZKx7MnpbEhh9jyipgxe19OcubqV5w
April 1, 2024
167258
Kenya
KEN
true
2
1
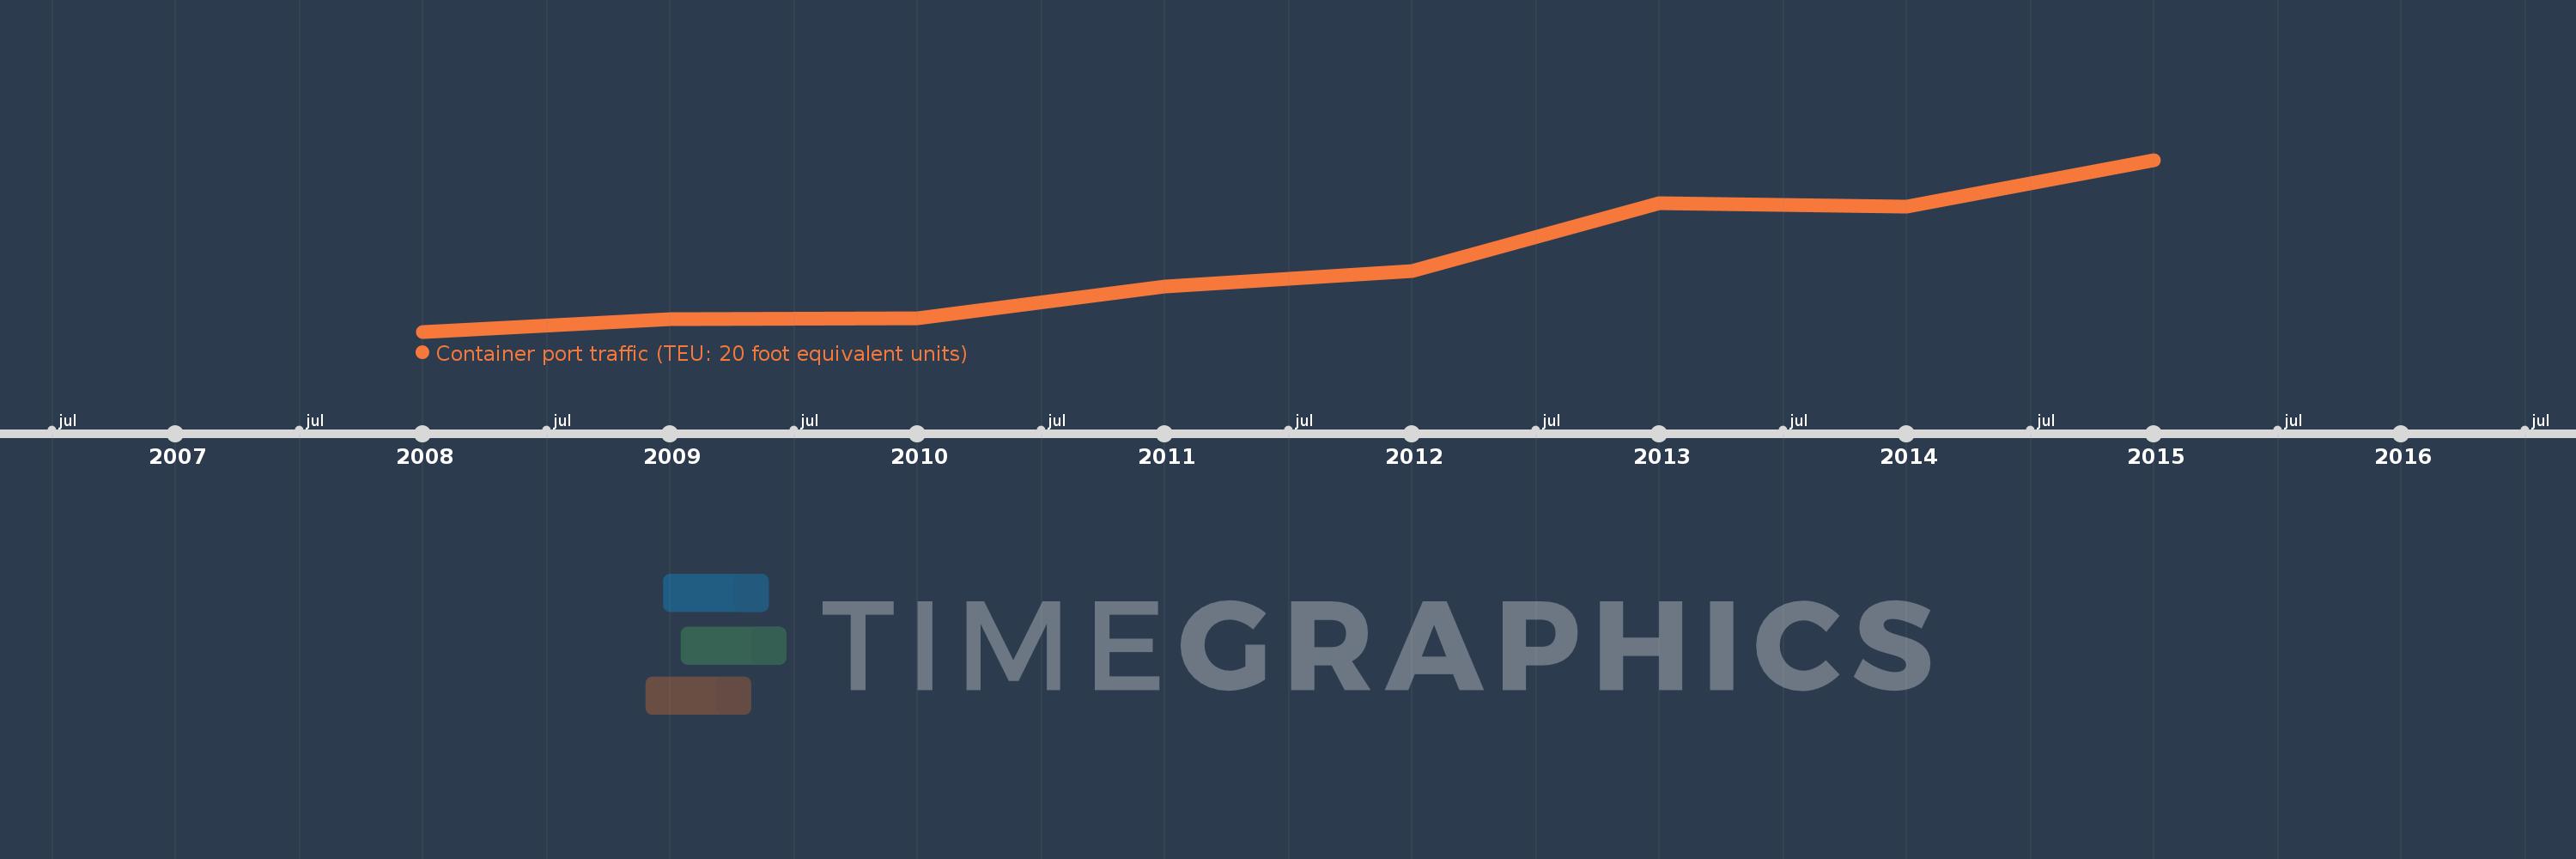
Container port traffic (TEU: 20 foot equivalent units)
2015,2014,2013,2012,2011,2010,2009,2008
This statistics in other country:
Timeline:
This timeline shows a graph from 2008 to 2015 of Kenya. No data until 2007. Number of actual observations by date: 8.
Source name:
World Development Indicators
Source organization:
Containerisation International, Containerisation International Yearbook.
Categories, topics:
Infrastructure
Last updated:
apr 23, 2017
Indicators value changes by year
Minimum:
585.367K
jan 1, 2008
Maximum:
1.01 mln
jan 1, 2015
At the date of observation
Value
Absolute change
Change from previous value
jan 1, 2008
585.367K
+585.367K
0.0%
jan 1, 2009
615.733K
+30.366K
5.19%
jan 1, 2010
618.816K
+3.083K
0.5%
jan 1, 2011
696.0K
+77.184K
12.47%
jan 1, 2012
735.672K
+39.672K
5.7%
jan 1, 2013
903.4K
+167.728K
22.8%
jan 1, 2014
894.0K
-9.4K
-1.04%
jan 1, 2015
1.01 mln
+116.0K
12.98%
Ranking of countries by current statistics by years


Comments: