29
/
en
AIzaSyAYiBZKx7MnpbEhh9jyipgxe19OcubqV5w
April 1, 2024
180914
Lithuania
LTU
true
2
1
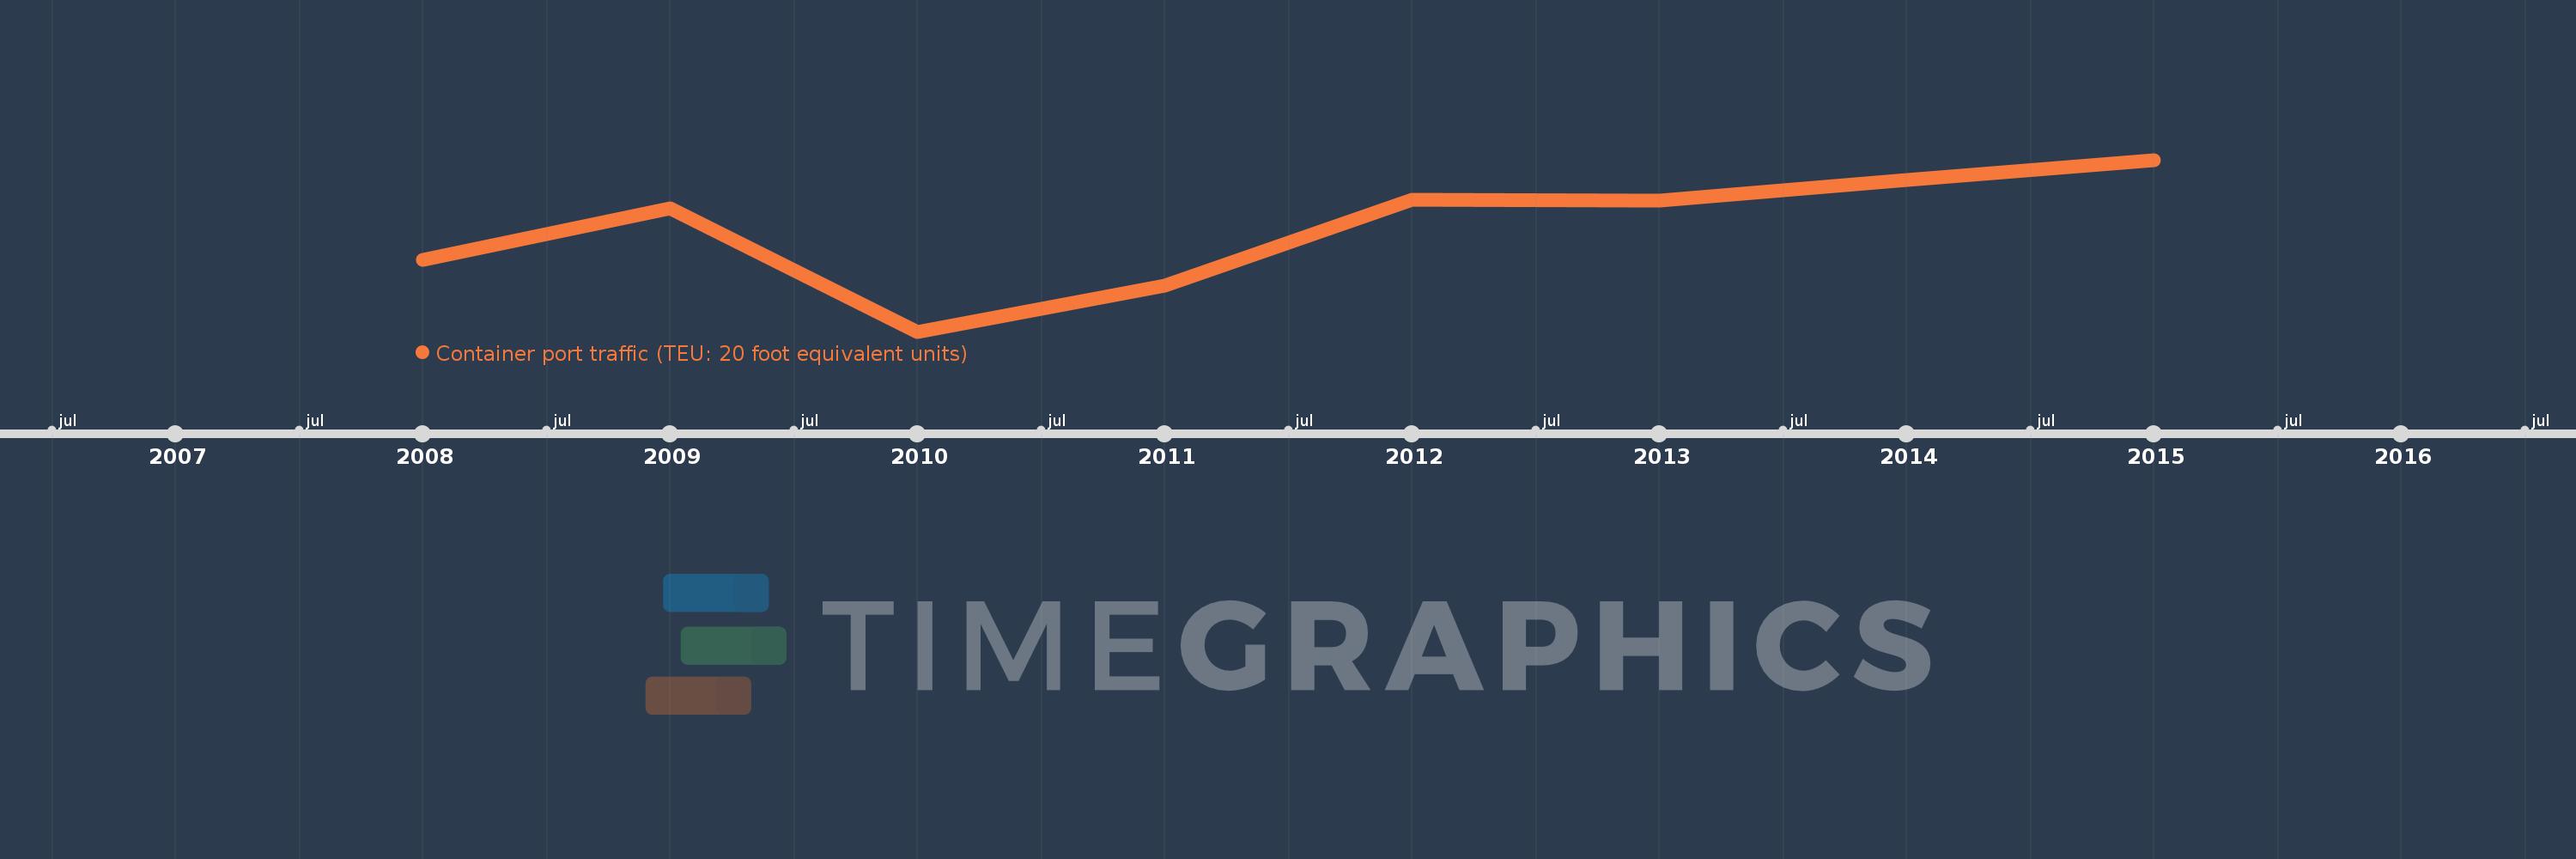
Container port traffic (TEU: 20 foot equivalent units)
2015,2014,2013,2012,2011,2010,2009,2008
This statistics in other country:
Timeline:
This timeline shows a graph from 2008 to 2015 of Lithuania. No data until 2007. Number of actual observations by date: 8.
Source name:
World Development Indicators
Source organization:
Containerisation International, Containerisation International Yearbook.
Categories, topics:
Infrastructure
Last updated:
apr 23, 2017
Indicators value changes by year
Minimum:
247.982K
jan 1, 2010
Maximum:
423.027K
jan 1, 2015
At the date of observation
Value
Absolute change
Change from previous value
jan 1, 2008
321.432K
+321.432K
0.0%
jan 1, 2009
373.263K
+51.831K
16.13%
jan 1, 2010
247.982K
-125.281K
-33.56%
jan 1, 2011
294.954K
+46.972K
18.94%
jan 1, 2012
382.2K
+87.246K
29.58%
jan 1, 2013
381.3K
-900.0
-0.24%
jan 1, 2014
402.5K
+21.2K
5.56%
jan 1, 2015
423.027K
+20.527K
5.1%
Ranking of countries by current statistics by years


Comments: