29
/
en
AIzaSyAYiBZKx7MnpbEhh9jyipgxe19OcubqV5w
April 1, 2024
45275
Low & middle income
LMY
false
2
1
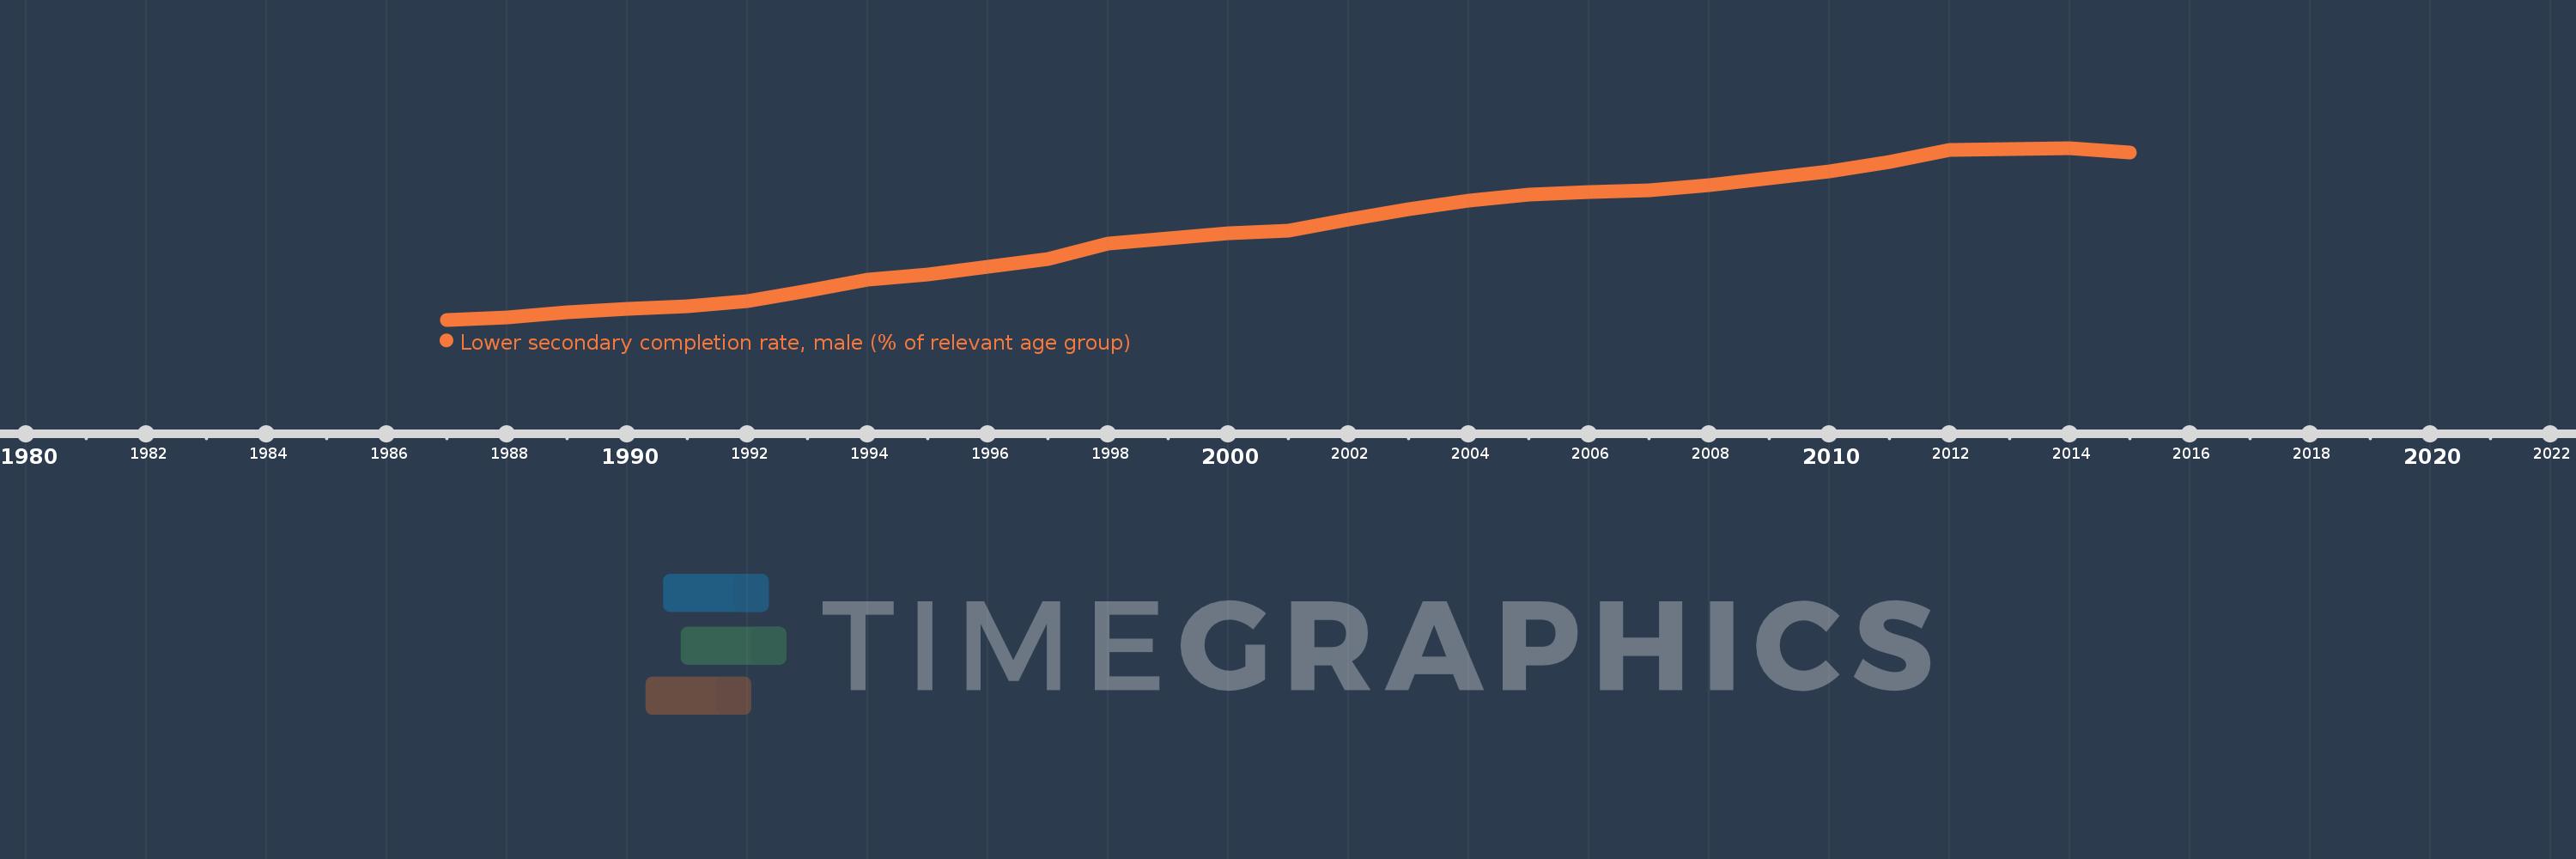
Lower secondary completion rate, male (% of relevant age group)
2015,2014,2013,2012,2011,2010,2009,2008,2007,2006,2005,2004,2003,2002,2001,2000,1999,1998,1997,1996,1995,1994,1993,1992,1991,1990,1989,1988,1987
This statistics in other country:
AfghanistanAlbaniaAlgeriaAngolaAntigua and BarbudaArab WorldArgentinaArmeniaArubaAustriaAzerbaijanBahamas, TheBahrainBangladeshBarbadosBelarusBelgiumBelizeBeninBermudaBhutanBoliviaBosnia and HerzegovinaBotswanaBrunei DarussalamBulgariaBurkina FasoBurundiCabo VerdeCambodiaCameroonCaribbean small statesCentral African RepublicCentral Europe and the BalticsChadChileChinaColombiaComorosCongo, Dem. Rep.Congo, Rep.Costa RicaCote d'IvoireCroatiaCubaCyprusCzech RepublicDenmarkDjiboutiDominicaDominican RepublicEarly-demographic dividendEast Asia & PacificEast Asia & Pacific (excluding high income)East Asia & Pacific (IDA & IBRD countries)EcuadorEgypt, Arab Rep.El SalvadorEquatorial GuineaEritreaEstoniaEthiopiaEuro areaEurope & Central AsiaEurope & Central Asia (excluding high income)Europe & Central Asia (IDA & IBRD countries)European UnionFijiFinlandFragile and conflict affected situationsFranceGabonGambia, TheGeorgiaGermanyGhanaGreeceGrenadaGuatemalaGuineaGuinea-BissauGuyanaHaitiHeavily indebted poor countries (HIPC)High incomeHondurasHong Kong SAR, ChinaHungaryIBRD onlyIcelandIDA & IBRD totalIDA blendIDA onlyIDA totalIndiaIndonesiaIran, Islamic Rep.IraqIrelandIsraelItalyJamaicaJapanJordanKazakhstanKenyaKiribatiKorea, Dem. People’s Rep.Korea, Rep.KuwaitKyrgyz RepublicLao PDRLate-demographic dividendLatin America & Caribbean Latin America & Caribbean (excluding high income)Latin America & the Caribbean (IDA & IBRD countries)LatviaLeast developed countries: UN classificationLebanonLesothoLiberiaLiechtensteinLithuaniaLow & middle incomeLow incomeLower middle incomeLuxembourgMacao SAR, ChinaMacedonia, FYRMadagascarMalawiMaldivesMaliMaltaMarshall IslandsMauritaniaMauritiusMexicoMiddle East & North AfricaMiddle East & North Africa (excluding high income)Middle East & North Africa (IDA & IBRD countries)Middle incomeMoldovaMongoliaMontenegroMoroccoMozambiqueMyanmarNamibiaNauruNepalNetherlandsNicaraguaNigerNorwayOECD membersOmanOther small statesPacific island small statesPakistanPalauPanamaPapua New GuineaParaguayPeruPhilippinesPolandPortugalPost-demographic dividendPre-demographic dividendQatarRomaniaRussian FederationRwandaSamoaSan MarinoSao Tome and PrincipeSaudi ArabiaSenegalSerbiaSeychellesSierra LeoneSlovak RepublicSloveniaSmall statesSolomon IslandsSouth AfricaSouth AsiaSouth Asia (IDA & IBRD)South SudanSpainSri LankaSt. Kitts and NevisSt. LuciaSt. Vincent and the GrenadinesSub-Saharan Africa Sub-Saharan Africa (excluding high income)Sub-Saharan Africa (IDA & IBRD countries)SudanSurinameSwazilandSwedenSwitzerlandSyrian Arab RepublicTajikistanTanzaniaThailandTimor-LesteTogoTongaTrinidad and TobagoTunisiaTurkeyTuvaluUgandaUkraineUnited Arab EmiratesUpper middle incomeUruguayUzbekistanVanuatuVenezuela, RBVietnamWest Bank and GazaWorldYemen, Rep.ZambiaZimbabwe Timeline:
This timeline shows a graph from 1987 to 2015 of Low & middle income. No data until 1986. Number of actual observations by date: 29.
Source name:
World Development Indicators
Source organization:
United Nations Educational, Scientific, and Cultural Organization (UNESCO) Institute for Statistics.
Categories, topics:
Education
Last updated:
apr 23, 2017
Indicators value changes by year
Minimum:
50.443
jan 1, 1987
Maximum:
73.448
jan 1, 2014
At the date of observation
Value
Absolute change
Change from previous value
jan 1, 1987
50.443
+50.443
0.0%
jan 1, 1988
50.763
+0.32
0.63%
jan 1, 1989
51.419
+0.656
1.29%
jan 1, 1990
51.858
+0.439
0.85%
jan 1, 1991
52.205
+0.346
0.67%
jan 1, 1992
52.952
+0.747
1.43%
jan 1, 1993
54.278
+1.326
2.5%
jan 1, 1994
55.81
+1.532
2.82%
jan 1, 1995
56.495
+0.685
1.23%
jan 1, 1996
57.528
+1.033
1.83%
jan 1, 1997
58.613
+1.085
1.89%
jan 1, 1998
60.616
+2.002
3.42%
jan 1, 1999
61.342
+0.726
1.2%
jan 1, 2000
62.077
+0.735
1.2%
jan 1, 2001
62.37
+0.293
0.47%
jan 1, 2002
63.918
+1.548
2.48%
jan 1, 2003
65.302
+1.384
2.17%
jan 1, 2004
66.404
+1.101
1.69%
jan 1, 2005
67.226
+0.823
1.24%
jan 1, 2006
67.596
+0.37
0.55%
jan 1, 2007
67.789
+0.193
0.29%
jan 1, 2008
68.515
+0.726
1.07%
jan 1, 2009
69.391
+0.875
1.28%
jan 1, 2010
70.305
+0.914
1.32%
jan 1, 2011
71.586
+1.282
1.82%
jan 1, 2012
73.216
+1.63
2.28%
jan 1, 2013
73.332
+0.115
0.16%
jan 1, 2014
73.448
+0.116
0.16%
jan 1, 2015
72.872
-0.575
-0.78%
Ranking of countries by current statistics by years


Comments: