30
/
AIzaSyAYiBZKx7MnpbEhh9jyipgxe19OcubqV5w
April 1, 2024
102658
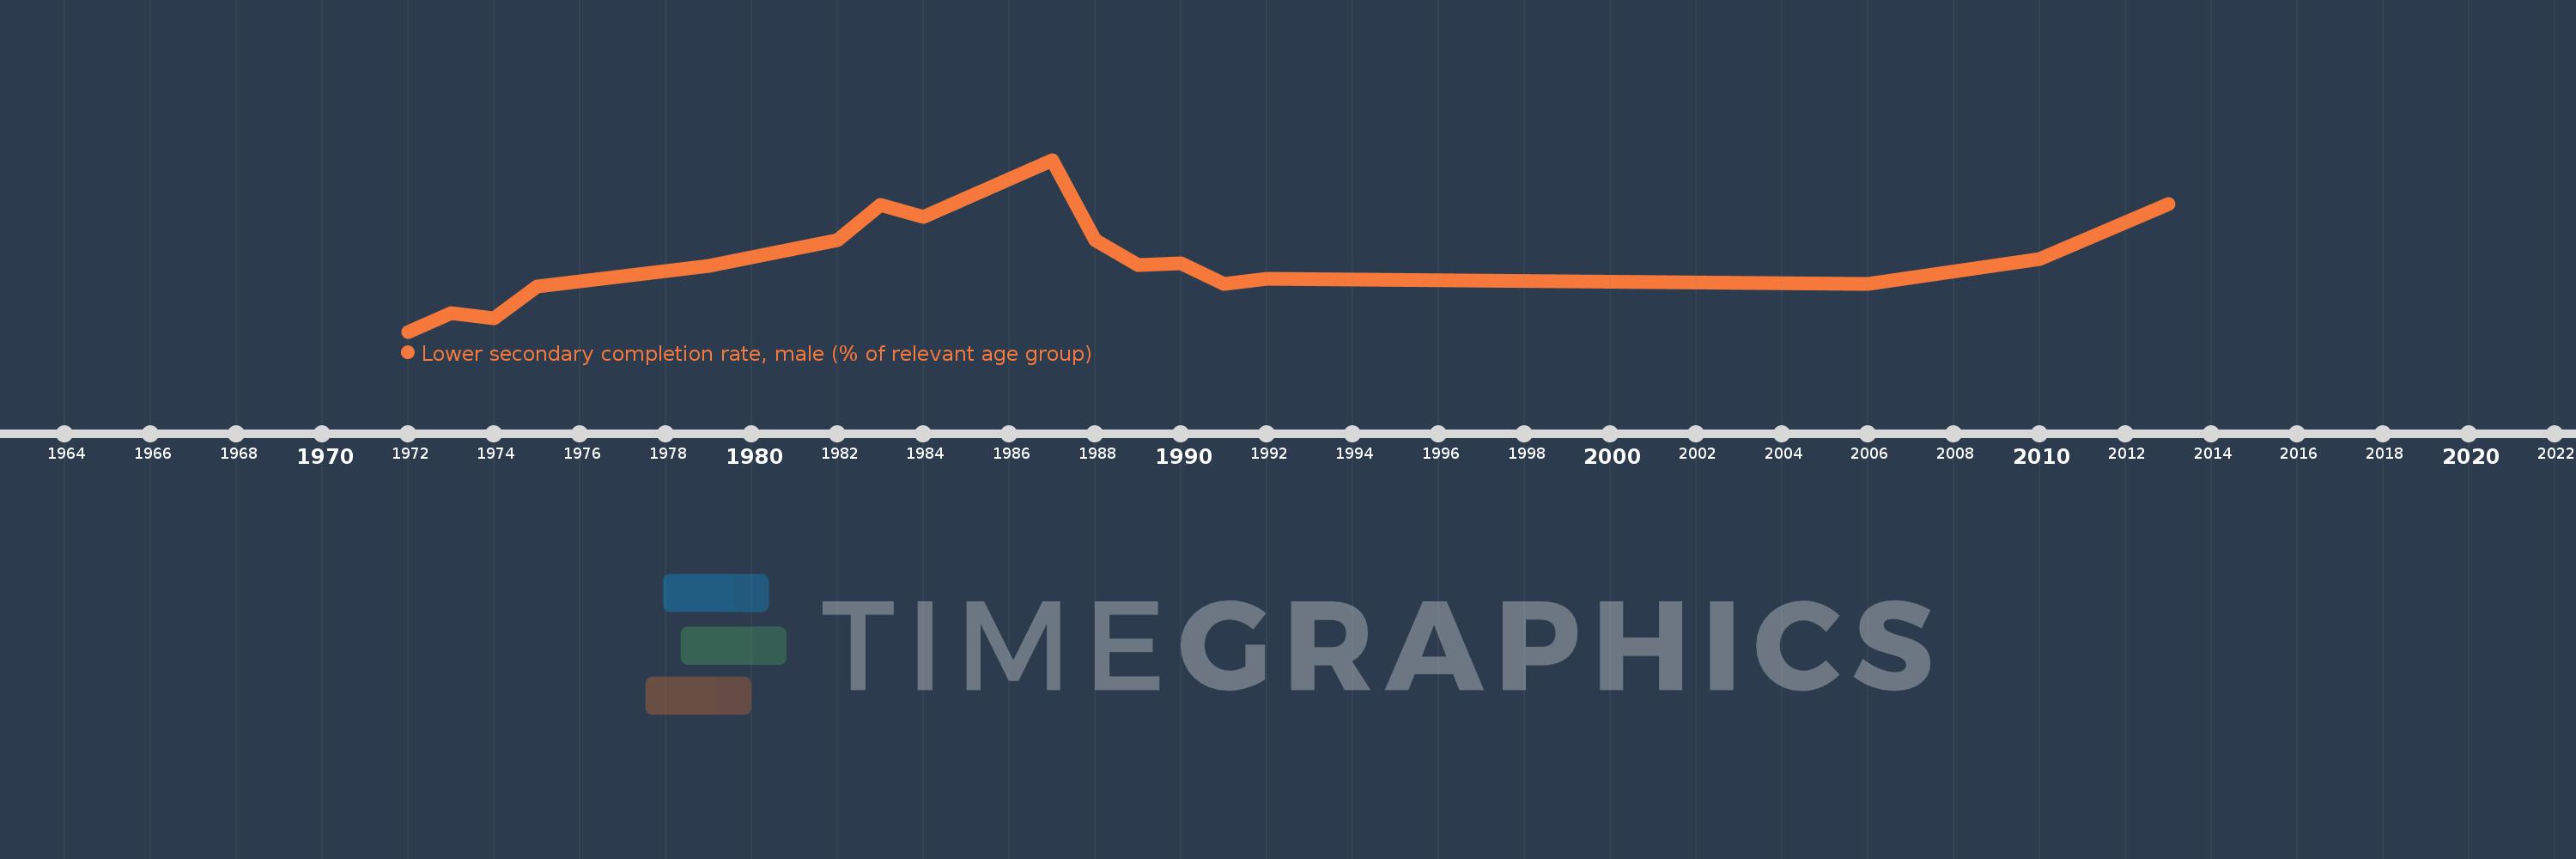
Central African Republic
CAF
true
2
1
Lower secondary completion rate, male (% of relevant age group)
2013,2010,2006,1992,1991,1990,1989,1988,1987,1984,1983,1982,1979,1975,1974,1973,1972
