29
/
en
AIzaSyAYiBZKx7MnpbEhh9jyipgxe19OcubqV5w
April 1, 2024
215499
Oman
OMN
true
2
1
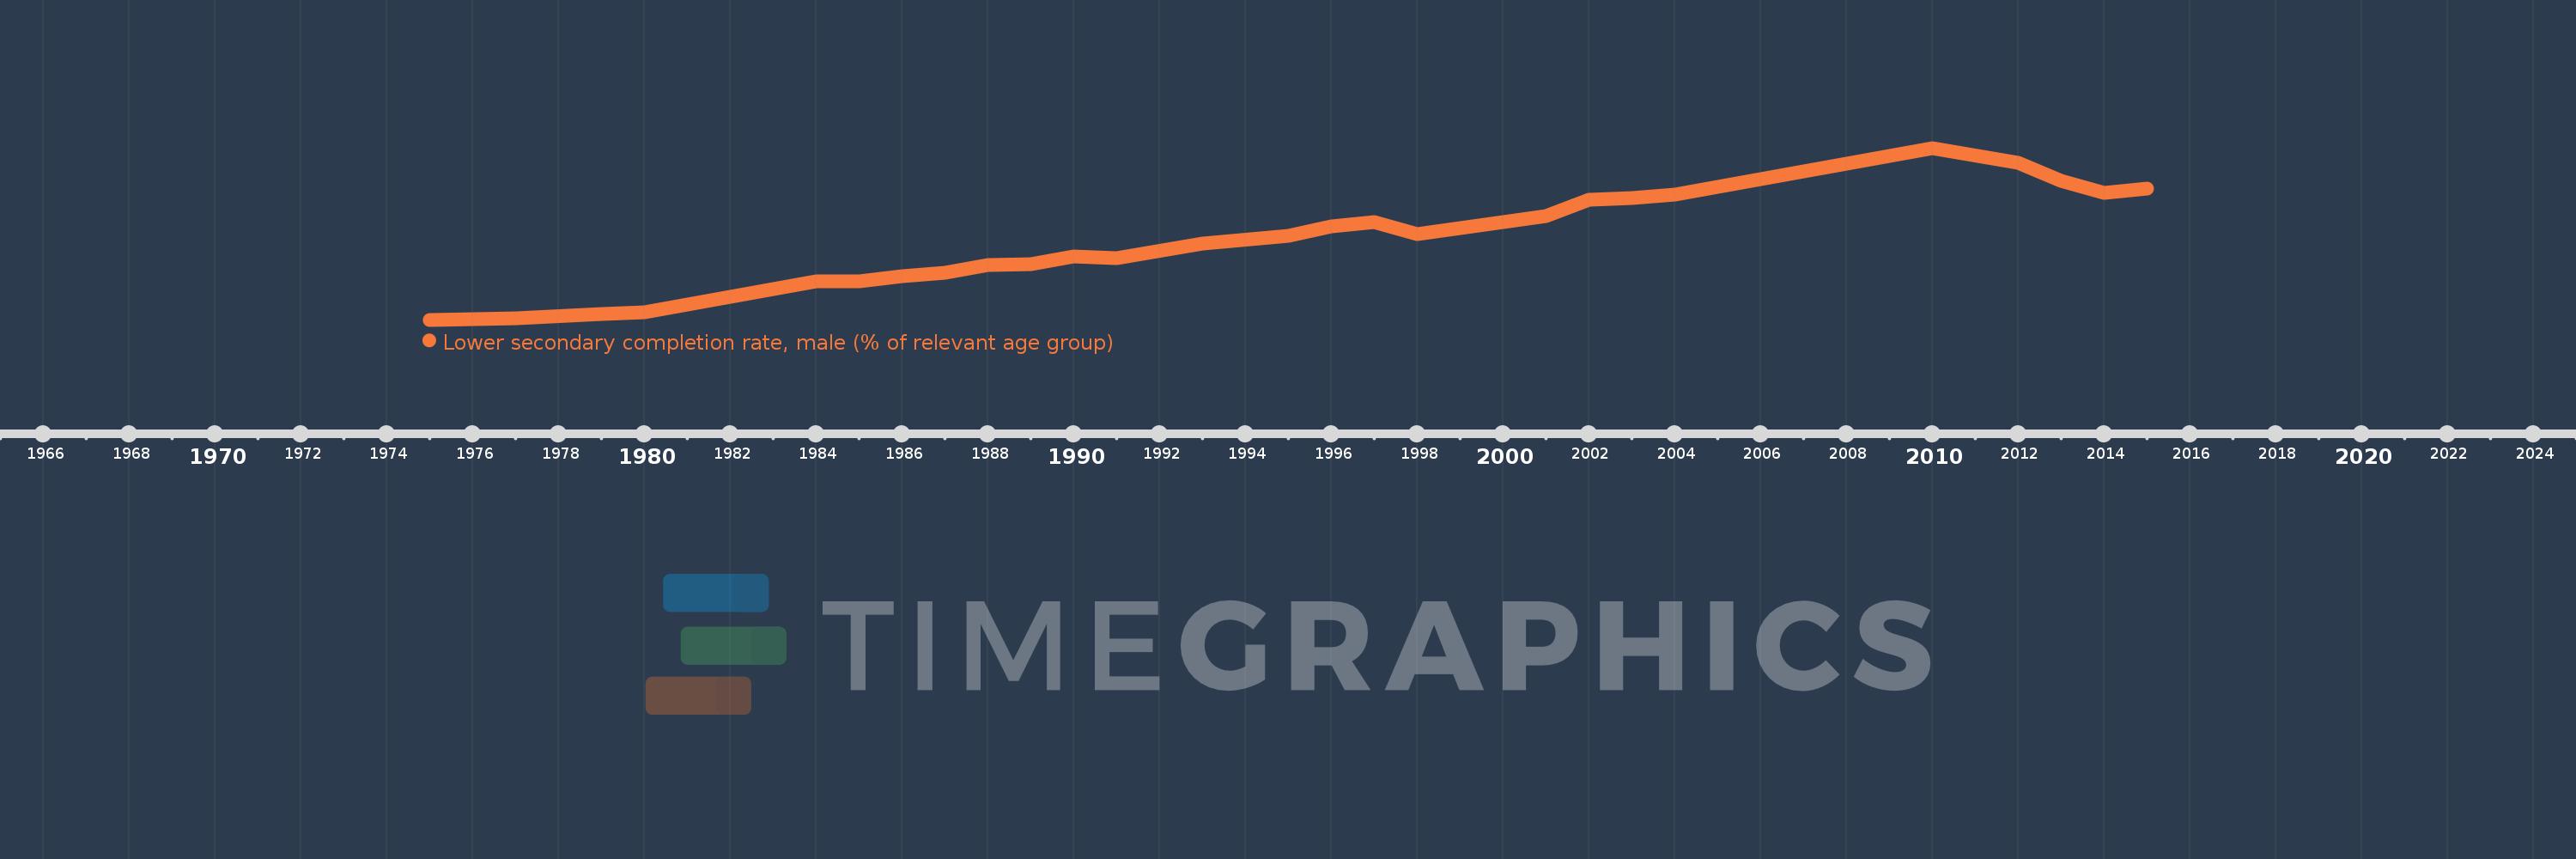
Lower secondary completion rate, male (% of relevant age group)
2015,2014,2013,2012,2010,2004,2003,2002,2001,1998,1997,1996,1995,1993,1991,1990,1989,1988,1987,1986,1985,1984,1980,1979,1977,1975
This statistics in other country:
AfghanistanAlbaniaAlgeriaAngolaAntigua and BarbudaArab WorldArgentinaArmeniaArubaAustriaAzerbaijanBahamas, TheBahrainBangladeshBarbadosBelarusBelgiumBelizeBeninBermudaBhutanBoliviaBosnia and HerzegovinaBotswanaBrunei DarussalamBulgariaBurkina FasoBurundiCabo VerdeCambodiaCameroonCaribbean small statesCentral African RepublicCentral Europe and the BalticsChadChileChinaColombiaComorosCongo, Dem. Rep.Congo, Rep.Costa RicaCote d'IvoireCroatiaCubaCyprusCzech RepublicDenmarkDjiboutiDominicaDominican RepublicEarly-demographic dividendEast Asia & PacificEast Asia & Pacific (excluding high income)East Asia & Pacific (IDA & IBRD countries)EcuadorEgypt, Arab Rep.El SalvadorEquatorial GuineaEritreaEstoniaEthiopiaEuro areaEurope & Central AsiaEurope & Central Asia (excluding high income)Europe & Central Asia (IDA & IBRD countries)European UnionFijiFinlandFragile and conflict affected situationsFranceGabonGambia, TheGeorgiaGermanyGhanaGreeceGrenadaGuatemalaGuineaGuinea-BissauGuyanaHaitiHeavily indebted poor countries (HIPC)High incomeHondurasHong Kong SAR, ChinaHungaryIBRD onlyIcelandIDA & IBRD totalIDA blendIDA onlyIDA totalIndiaIndonesiaIran, Islamic Rep.IraqIrelandIsraelItalyJamaicaJapanJordanKazakhstanKenyaKiribatiKorea, Dem. People’s Rep.Korea, Rep.KuwaitKyrgyz RepublicLao PDRLate-demographic dividendLatin America & Caribbean Latin America & Caribbean (excluding high income)Latin America & the Caribbean (IDA & IBRD countries)LatviaLeast developed countries: UN classificationLebanonLesothoLiberiaLiechtensteinLithuaniaLow & middle incomeLow incomeLower middle incomeLuxembourgMacao SAR, ChinaMacedonia, FYRMadagascarMalawiMaldivesMaliMaltaMarshall IslandsMauritaniaMauritiusMexicoMiddle East & North AfricaMiddle East & North Africa (excluding high income)Middle East & North Africa (IDA & IBRD countries)Middle incomeMoldovaMongoliaMontenegroMoroccoMozambiqueMyanmarNamibiaNauruNepalNetherlandsNicaraguaNigerNorwayOECD membersOmanOther small statesPacific island small statesPakistanPalauPanamaPapua New GuineaParaguayPeruPhilippinesPolandPortugalPost-demographic dividendPre-demographic dividendQatarRomaniaRussian FederationRwandaSamoaSan MarinoSao Tome and PrincipeSaudi ArabiaSenegalSerbiaSeychellesSierra LeoneSlovak RepublicSloveniaSmall statesSolomon IslandsSouth AfricaSouth AsiaSouth Asia (IDA & IBRD)South SudanSpainSri LankaSt. Kitts and NevisSt. LuciaSt. Vincent and the GrenadinesSub-Saharan Africa Sub-Saharan Africa (excluding high income)Sub-Saharan Africa (IDA & IBRD countries)SudanSurinameSwazilandSwedenSwitzerlandSyrian Arab RepublicTajikistanTanzaniaThailandTimor-LesteTogoTongaTrinidad and TobagoTunisiaTurkeyTuvaluUgandaUkraineUnited Arab EmiratesUpper middle incomeUruguayUzbekistanVanuatuVenezuela, RBVietnamWest Bank and GazaWorldYemen, Rep.ZambiaZimbabwe Timeline:
This timeline shows a graph from 1975 to 2015 of Oman. No data until 1974. Number of actual observations by date: 26.
Source name:
World Development Indicators
Source organization:
United Nations Educational, Scientific, and Cultural Organization (UNESCO) Institute for Statistics.
Categories, topics:
Education
Last updated:
apr 23, 2017
Indicators value changes by year
Maximum:
115.363
jan 1, 2010
At the date of observation
Value
Absolute change
Change from previous value
jan 1, 1975
0.343
+0.343
0.0%
jan 1, 1977
1.336
+0.993
289.39%
jan 1, 1979
4.128
+2.792
208.94%
jan 1, 1980
5.225
+1.096
26.56%
jan 1, 1984
26.184
+20.959
401.16%
jan 1, 1985
26.304
+0.12
0.46%
jan 1, 1986
29.573
+3.269
12.43%
jan 1, 1987
31.953
+2.38
8.05%
jan 1, 1988
36.813
+4.86
15.21%
jan 1, 1989
37.302
+0.488
1.33%
jan 1, 1990
42.764
+5.462
14.64%
jan 1, 1991
41.654
-1.11
-2.6%
jan 1, 1993
51.318
+9.665
23.2%
jan 1, 1995
56.348
+5.03
9.8%
jan 1, 1996
62.64
+6.292
11.17%
jan 1, 1997
65.706
+3.065
4.89%
jan 1, 1998
57.651
-8.055
-12.26%
jan 1, 2001
69.749
+12.098
20.98%
jan 1, 2002
80.576
+10.827
15.52%
jan 1, 2003
81.692
+1.115
1.38%
jan 1, 2004
83.929
+2.238
2.74%
jan 1, 2010
115.363
+31.434
37.45%
jan 1, 2012
105.201
-10.162
-8.81%
jan 1, 2013
93.172
-12.029
-11.43%
jan 1, 2014
85.2
-7.972
-8.56%
jan 1, 2015
88.028
+2.828
3.32%
Ranking of countries by current statistics by years


Comments: