29
/
en
AIzaSyAYiBZKx7MnpbEhh9jyipgxe19OcubqV5w
April 1, 2024
238455
Seychelles
SYC
true
2
1
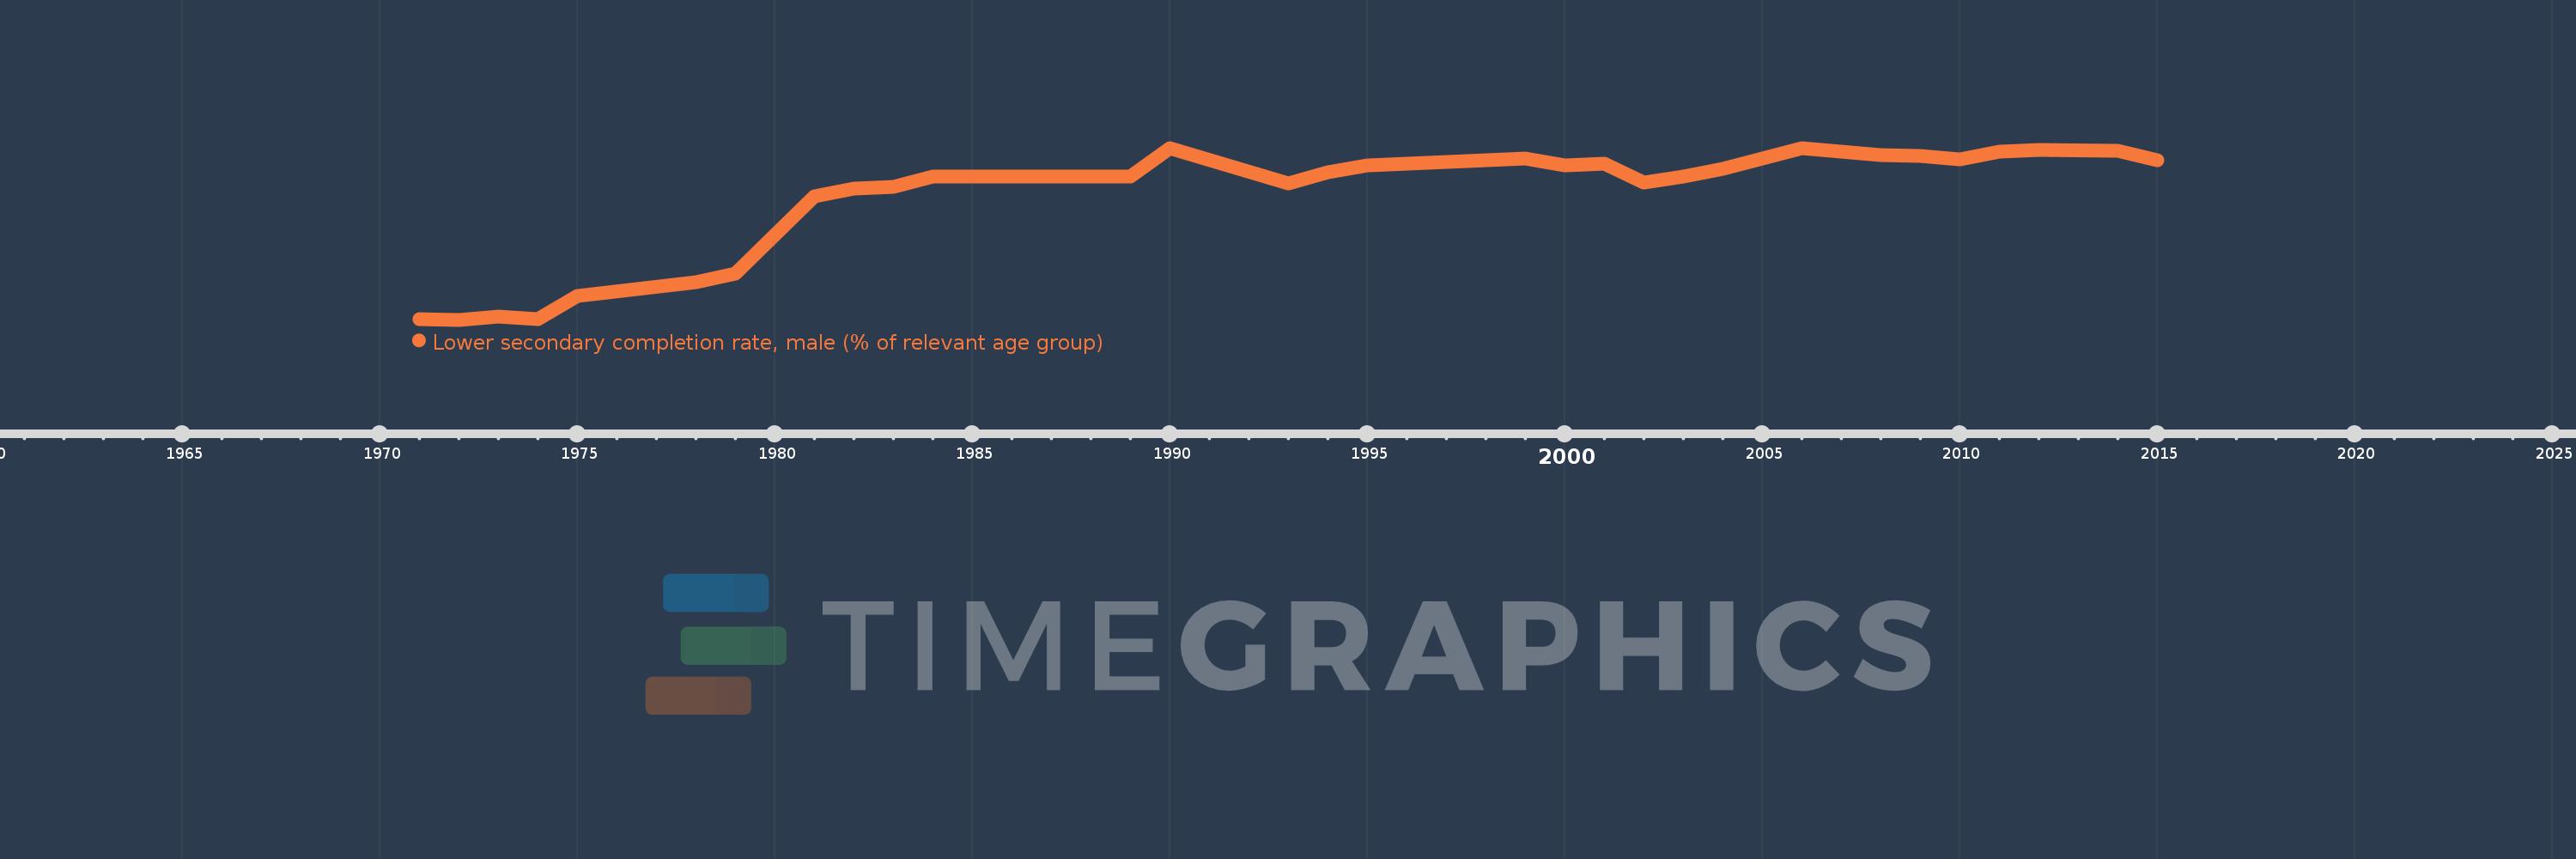
Lower secondary completion rate, male (% of relevant age group)
2015,2014,2012,2011,2010,2009,2008,2006,2004,2003,2002,2001,2000,1999,1995,1994,1993,1990,1989,1984,1983,1982,1981,1979,1978,1975,1974,1973,1972,1971
This statistics in other country:
AfghanistanAlbaniaAlgeriaAngolaAntigua and BarbudaArab WorldArgentinaArmeniaArubaAustriaAzerbaijanBahamas, TheBahrainBangladeshBarbadosBelarusBelgiumBelizeBeninBermudaBhutanBoliviaBosnia and HerzegovinaBotswanaBrunei DarussalamBulgariaBurkina FasoBurundiCabo VerdeCambodiaCameroonCaribbean small statesCentral African RepublicCentral Europe and the BalticsChadChileChinaColombiaComorosCongo, Dem. Rep.Congo, Rep.Costa RicaCote d'IvoireCroatiaCubaCyprusCzech RepublicDenmarkDjiboutiDominicaDominican RepublicEarly-demographic dividendEast Asia & PacificEast Asia & Pacific (excluding high income)East Asia & Pacific (IDA & IBRD countries)EcuadorEgypt, Arab Rep.El SalvadorEquatorial GuineaEritreaEstoniaEthiopiaEuro areaEurope & Central AsiaEurope & Central Asia (excluding high income)Europe & Central Asia (IDA & IBRD countries)European UnionFijiFinlandFragile and conflict affected situationsFranceGabonGambia, TheGeorgiaGermanyGhanaGreeceGrenadaGuatemalaGuineaGuinea-BissauGuyanaHaitiHeavily indebted poor countries (HIPC)High incomeHondurasHong Kong SAR, ChinaHungaryIBRD onlyIcelandIDA & IBRD totalIDA blendIDA onlyIDA totalIndiaIndonesiaIran, Islamic Rep.IraqIrelandIsraelItalyJamaicaJapanJordanKazakhstanKenyaKiribatiKorea, Dem. People’s Rep.Korea, Rep.KuwaitKyrgyz RepublicLao PDRLate-demographic dividendLatin America & Caribbean Latin America & Caribbean (excluding high income)Latin America & the Caribbean (IDA & IBRD countries)LatviaLeast developed countries: UN classificationLebanonLesothoLiberiaLiechtensteinLithuaniaLow & middle incomeLow incomeLower middle incomeLuxembourgMacao SAR, ChinaMacedonia, FYRMadagascarMalawiMaldivesMaliMaltaMarshall IslandsMauritaniaMauritiusMexicoMiddle East & North AfricaMiddle East & North Africa (excluding high income)Middle East & North Africa (IDA & IBRD countries)Middle incomeMoldovaMongoliaMontenegroMoroccoMozambiqueMyanmarNamibiaNauruNepalNetherlandsNicaraguaNigerNorwayOECD membersOmanOther small statesPacific island small statesPakistanPalauPanamaPapua New GuineaParaguayPeruPhilippinesPolandPortugalPost-demographic dividendPre-demographic dividendQatarRomaniaRussian FederationRwandaSamoaSan MarinoSao Tome and PrincipeSaudi ArabiaSenegalSerbiaSeychellesSierra LeoneSlovak RepublicSloveniaSmall statesSolomon IslandsSouth AfricaSouth AsiaSouth Asia (IDA & IBRD)South SudanSpainSri LankaSt. Kitts and NevisSt. LuciaSt. Vincent and the GrenadinesSub-Saharan Africa Sub-Saharan Africa (excluding high income)Sub-Saharan Africa (IDA & IBRD countries)SudanSurinameSwazilandSwedenSwitzerlandSyrian Arab RepublicTajikistanTanzaniaThailandTimor-LesteTogoTongaTrinidad and TobagoTunisiaTurkeyTuvaluUgandaUkraineUnited Arab EmiratesUpper middle incomeUruguayUzbekistanVanuatuVenezuela, RBVietnamWest Bank and GazaWorldYemen, Rep.ZambiaZimbabwe Timeline:
This timeline shows a graph from 1971 to 2015 of Seychelles. No data until 1970. Number of actual observations by date: 30.
Source name:
World Development Indicators
Source organization:
United Nations Educational, Scientific, and Cultural Organization (UNESCO) Institute for Statistics.
Categories, topics:
Education
Last updated:
apr 23, 2017
Indicators value changes by year
Maximum:
110.807
jan 1, 1990
At the date of observation
Value
Absolute change
Change from previous value
jan 1, 1971
7.303
+7.303
0.0%
jan 1, 1972
6.715
-0.587
-8.04%
jan 1, 1973
8.752
+2.036
30.33%
jan 1, 1974
6.964
-1.788
-20.43%
jan 1, 1975
21.2
+14.236
204.43%
jan 1, 1978
29.248
+8.048
37.96%
jan 1, 1979
34.495
+5.248
17.94%
jan 1, 1981
81.332
+46.837
135.78%
jan 1, 1982
86.38
+5.048
6.21%
jan 1, 1983
87.304
+0.924
1.07%
jan 1, 1984
93.293
+5.989
6.86%
jan 1, 1989
93.726
+0.434
0.46%
jan 1, 1990
110.807
+17.081
18.22%
jan 1, 1993
89.17
-21.638
-19.53%
jan 1, 1994
96.131
+6.961
7.81%
jan 1, 1995
100.0
+3.869
4.03%
jan 1, 1999
104.617
+4.617
4.62%
jan 1, 2000
100.0
-4.617
-4.41%
jan 1, 2001
101.324
+1.324
1.32%
jan 1, 2002
89.853
-11.47
-11.32%
jan 1, 2003
93.5
+3.647
4.06%
jan 1, 2004
98.342
+4.842
5.18%
jan 1, 2006
110.526
+12.184
12.39%
jan 1, 2008
106.306
-4.22
-3.82%
jan 1, 2009
106.112
-0.194
-0.18%
jan 1, 2010
104.128
-1.984
-1.87%
jan 1, 2011
108.779
+4.651
4.47%
jan 1, 2012
109.687
+0.907
0.83%
jan 1, 2014
108.846
-0.841
-0.77%
jan 1, 2015
103.343
-5.502
-5.05%
Ranking of countries by current statistics by years


Comments: