29
/
en
AIzaSyAYiBZKx7MnpbEhh9jyipgxe19OcubqV5w
April 1, 2024
194488
Mauritius
MUS
true
2
1
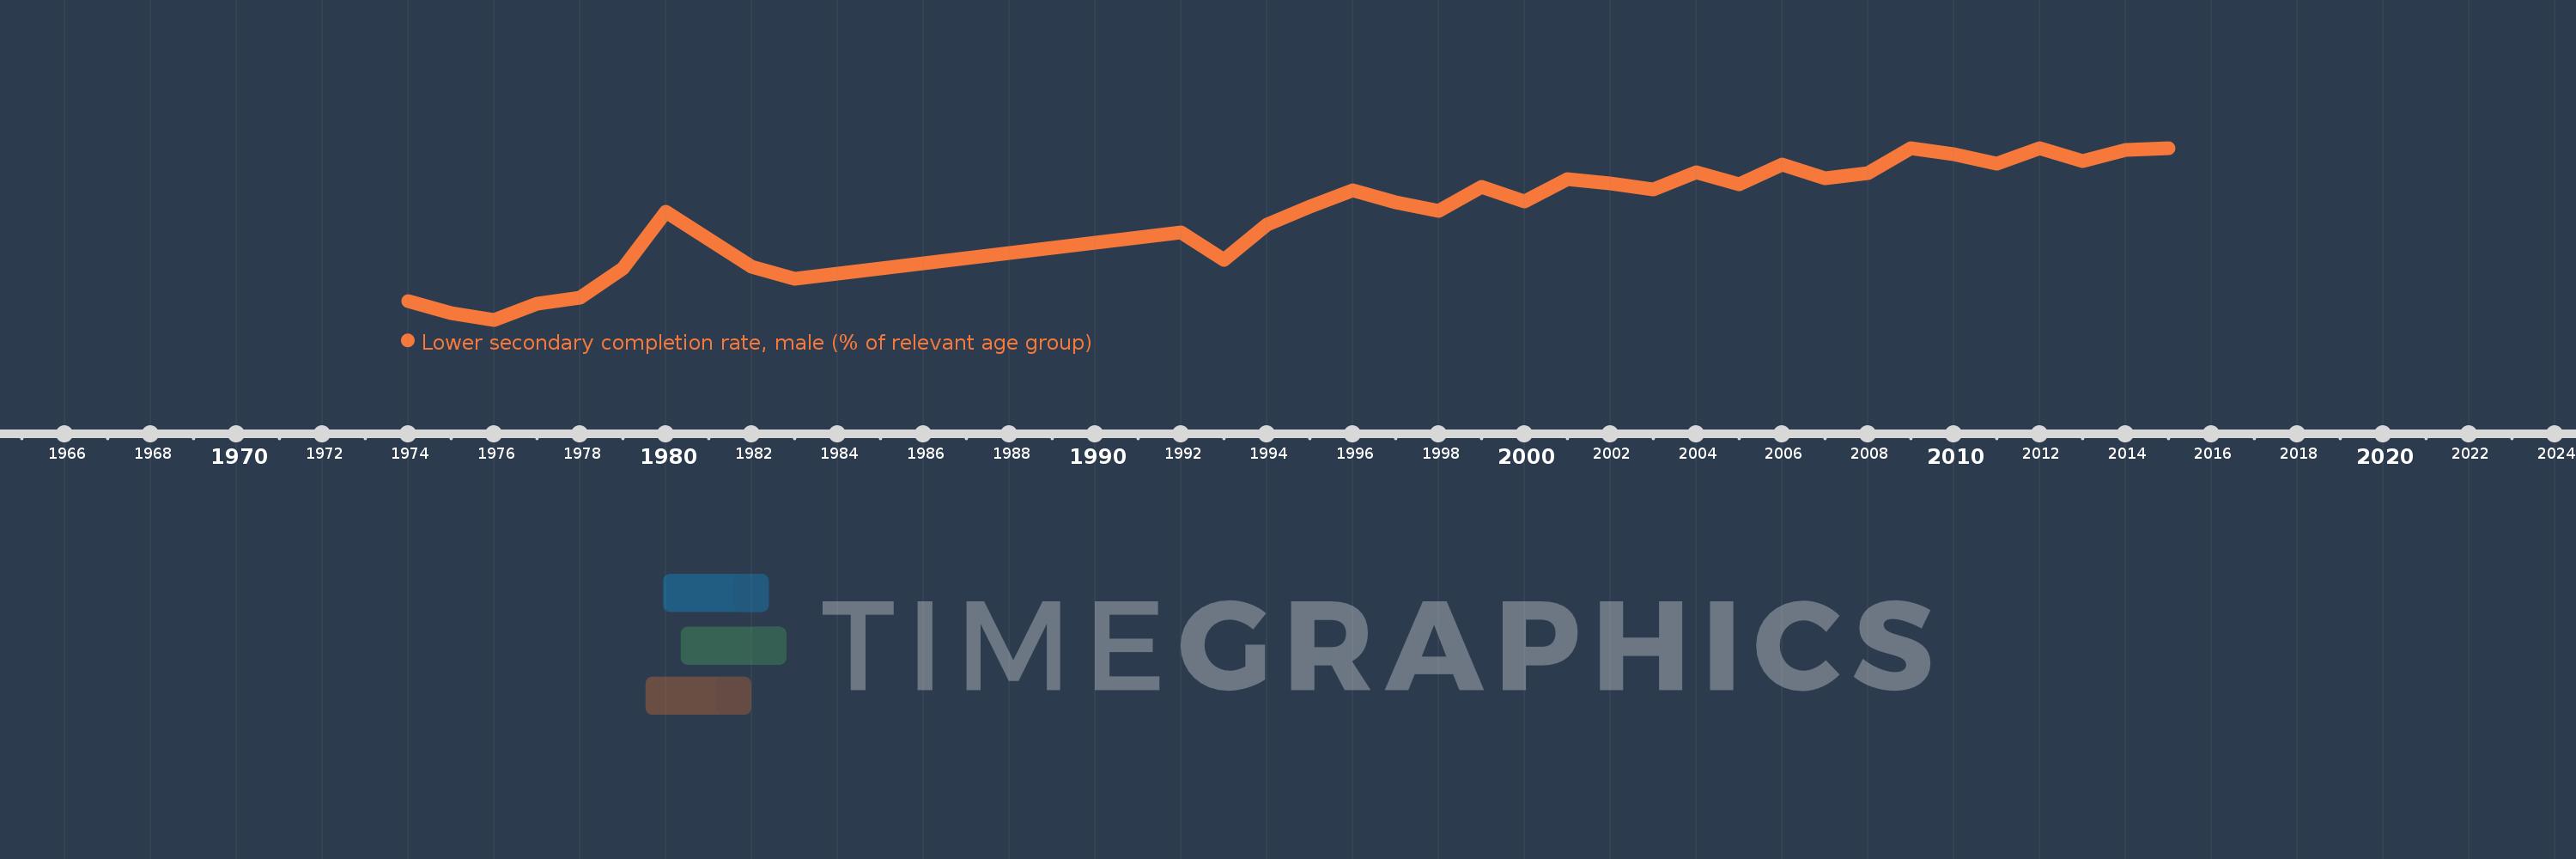
Lower secondary completion rate, male (% of relevant age group)
2015,2014,2013,2012,2011,2010,2009,2008,2007,2006,2005,2004,2003,2002,2001,2000,1999,1998,1997,1996,1995,1994,1993,1992,1983,1982,1980,1979,1978,1977,1976,1975,1974
This statistics in other country:
AfghanistanAlbaniaAlgeriaAngolaAntigua and BarbudaArab WorldArgentinaArmeniaArubaAustriaAzerbaijanBahamas, TheBahrainBangladeshBarbadosBelarusBelgiumBelizeBeninBermudaBhutanBoliviaBosnia and HerzegovinaBotswanaBrunei DarussalamBulgariaBurkina FasoBurundiCabo VerdeCambodiaCameroonCaribbean small statesCentral African RepublicCentral Europe and the BalticsChadChileChinaColombiaComorosCongo, Dem. Rep.Congo, Rep.Costa RicaCote d'IvoireCroatiaCubaCyprusCzech RepublicDenmarkDjiboutiDominicaDominican RepublicEarly-demographic dividendEast Asia & PacificEast Asia & Pacific (excluding high income)East Asia & Pacific (IDA & IBRD countries)EcuadorEgypt, Arab Rep.El SalvadorEquatorial GuineaEritreaEstoniaEthiopiaEuro areaEurope & Central AsiaEurope & Central Asia (excluding high income)Europe & Central Asia (IDA & IBRD countries)European UnionFijiFinlandFragile and conflict affected situationsFranceGabonGambia, TheGeorgiaGermanyGhanaGreeceGrenadaGuatemalaGuineaGuinea-BissauGuyanaHaitiHeavily indebted poor countries (HIPC)High incomeHondurasHong Kong SAR, ChinaHungaryIBRD onlyIcelandIDA & IBRD totalIDA blendIDA onlyIDA totalIndiaIndonesiaIran, Islamic Rep.IraqIrelandIsraelItalyJamaicaJapanJordanKazakhstanKenyaKiribatiKorea, Dem. People’s Rep.Korea, Rep.KuwaitKyrgyz RepublicLao PDRLate-demographic dividendLatin America & Caribbean Latin America & Caribbean (excluding high income)Latin America & the Caribbean (IDA & IBRD countries)LatviaLeast developed countries: UN classificationLebanonLesothoLiberiaLiechtensteinLithuaniaLow & middle incomeLow incomeLower middle incomeLuxembourgMacao SAR, ChinaMacedonia, FYRMadagascarMalawiMaldivesMaliMaltaMarshall IslandsMauritaniaMauritiusMexicoMiddle East & North AfricaMiddle East & North Africa (excluding high income)Middle East & North Africa (IDA & IBRD countries)Middle incomeMoldovaMongoliaMontenegroMoroccoMozambiqueMyanmarNamibiaNauruNepalNetherlandsNicaraguaNigerNorwayOECD membersOmanOther small statesPacific island small statesPakistanPalauPanamaPapua New GuineaParaguayPeruPhilippinesPolandPortugalPost-demographic dividendPre-demographic dividendQatarRomaniaRussian FederationRwandaSamoaSan MarinoSao Tome and PrincipeSaudi ArabiaSenegalSerbiaSeychellesSierra LeoneSlovak RepublicSloveniaSmall statesSolomon IslandsSouth AfricaSouth AsiaSouth Asia (IDA & IBRD)South SudanSpainSri LankaSt. Kitts and NevisSt. LuciaSt. Vincent and the GrenadinesSub-Saharan Africa Sub-Saharan Africa (excluding high income)Sub-Saharan Africa (IDA & IBRD countries)SudanSurinameSwazilandSwedenSwitzerlandSyrian Arab RepublicTajikistanTanzaniaThailandTimor-LesteTogoTongaTrinidad and TobagoTunisiaTurkeyTuvaluUgandaUkraineUnited Arab EmiratesUpper middle incomeUruguayUzbekistanVanuatuVenezuela, RBVietnamWest Bank and GazaWorldYemen, Rep.ZambiaZimbabwe Timeline:
This timeline shows a graph from 1974 to 2015 of Mauritius. No data until 1973. Number of actual observations by date: 33.
Source name:
World Development Indicators
Source organization:
United Nations Educational, Scientific, and Cultural Organization (UNESCO) Institute for Statistics.
Categories, topics:
Education
Last updated:
apr 23, 2017
Indicators value changes by year
Minimum:
40.636
jan 1, 1976
Maximum:
80.106
jan 1, 2012
At the date of observation
Value
Absolute change
Change from previous value
jan 1, 1974
44.959
+44.959
0.0%
jan 1, 1975
42.088
-2.871
-6.39%
jan 1, 1976
40.636
-1.453
-3.45%
jan 1, 1977
44.347
+3.712
9.13%
jan 1, 1978
45.732
+1.385
3.12%
jan 1, 1979
52.373
+6.64
14.52%
jan 1, 1980
65.477
+13.104
25.02%
jan 1, 1982
52.773
-12.703
-19.4%
jan 1, 1983
50.103
-2.671
-5.06%
jan 1, 1992
60.628
+10.525
21.01%
jan 1, 1993
54.324
-6.304
-10.4%
jan 1, 1994
62.531
+8.207
15.11%
jan 1, 1995
66.625
+4.094
6.55%
jan 1, 1996
70.352
+3.727
5.59%
jan 1, 1997
67.622
-2.73
-3.88%
jan 1, 1998
65.729
-1.892
-2.8%
jan 1, 1999
71.088
+5.359
8.15%
jan 1, 2000
67.867
-3.221
-4.53%
jan 1, 2001
73.01
+5.143
7.58%
jan 1, 2002
72.023
-0.987
-1.35%
jan 1, 2003
70.497
-1.526
-2.12%
jan 1, 2004
74.497
+4.0
5.67%
jan 1, 2005
71.839
-2.658
-3.57%
jan 1, 2006
76.386
+4.547
6.33%
jan 1, 2007
73.221
-3.165
-4.14%
jan 1, 2008
74.391
+1.171
1.6%
jan 1, 2009
80.026
+5.635
7.58%
jan 1, 2010
78.736
-1.29
-1.61%
jan 1, 2011
76.519
-2.217
-2.82%
jan 1, 2012
80.106
+3.586
4.69%
jan 1, 2013
77.07
-3.035
-3.79%
jan 1, 2014
79.682
+2.611
3.39%
jan 1, 2015
80.028
+0.347
0.43%
Ranking of countries by current statistics by years


Comments: