29
/
en
AIzaSyAYiBZKx7MnpbEhh9jyipgxe19OcubqV5w
April 1, 2024
126442
El Salvador
SLV
true
2
1
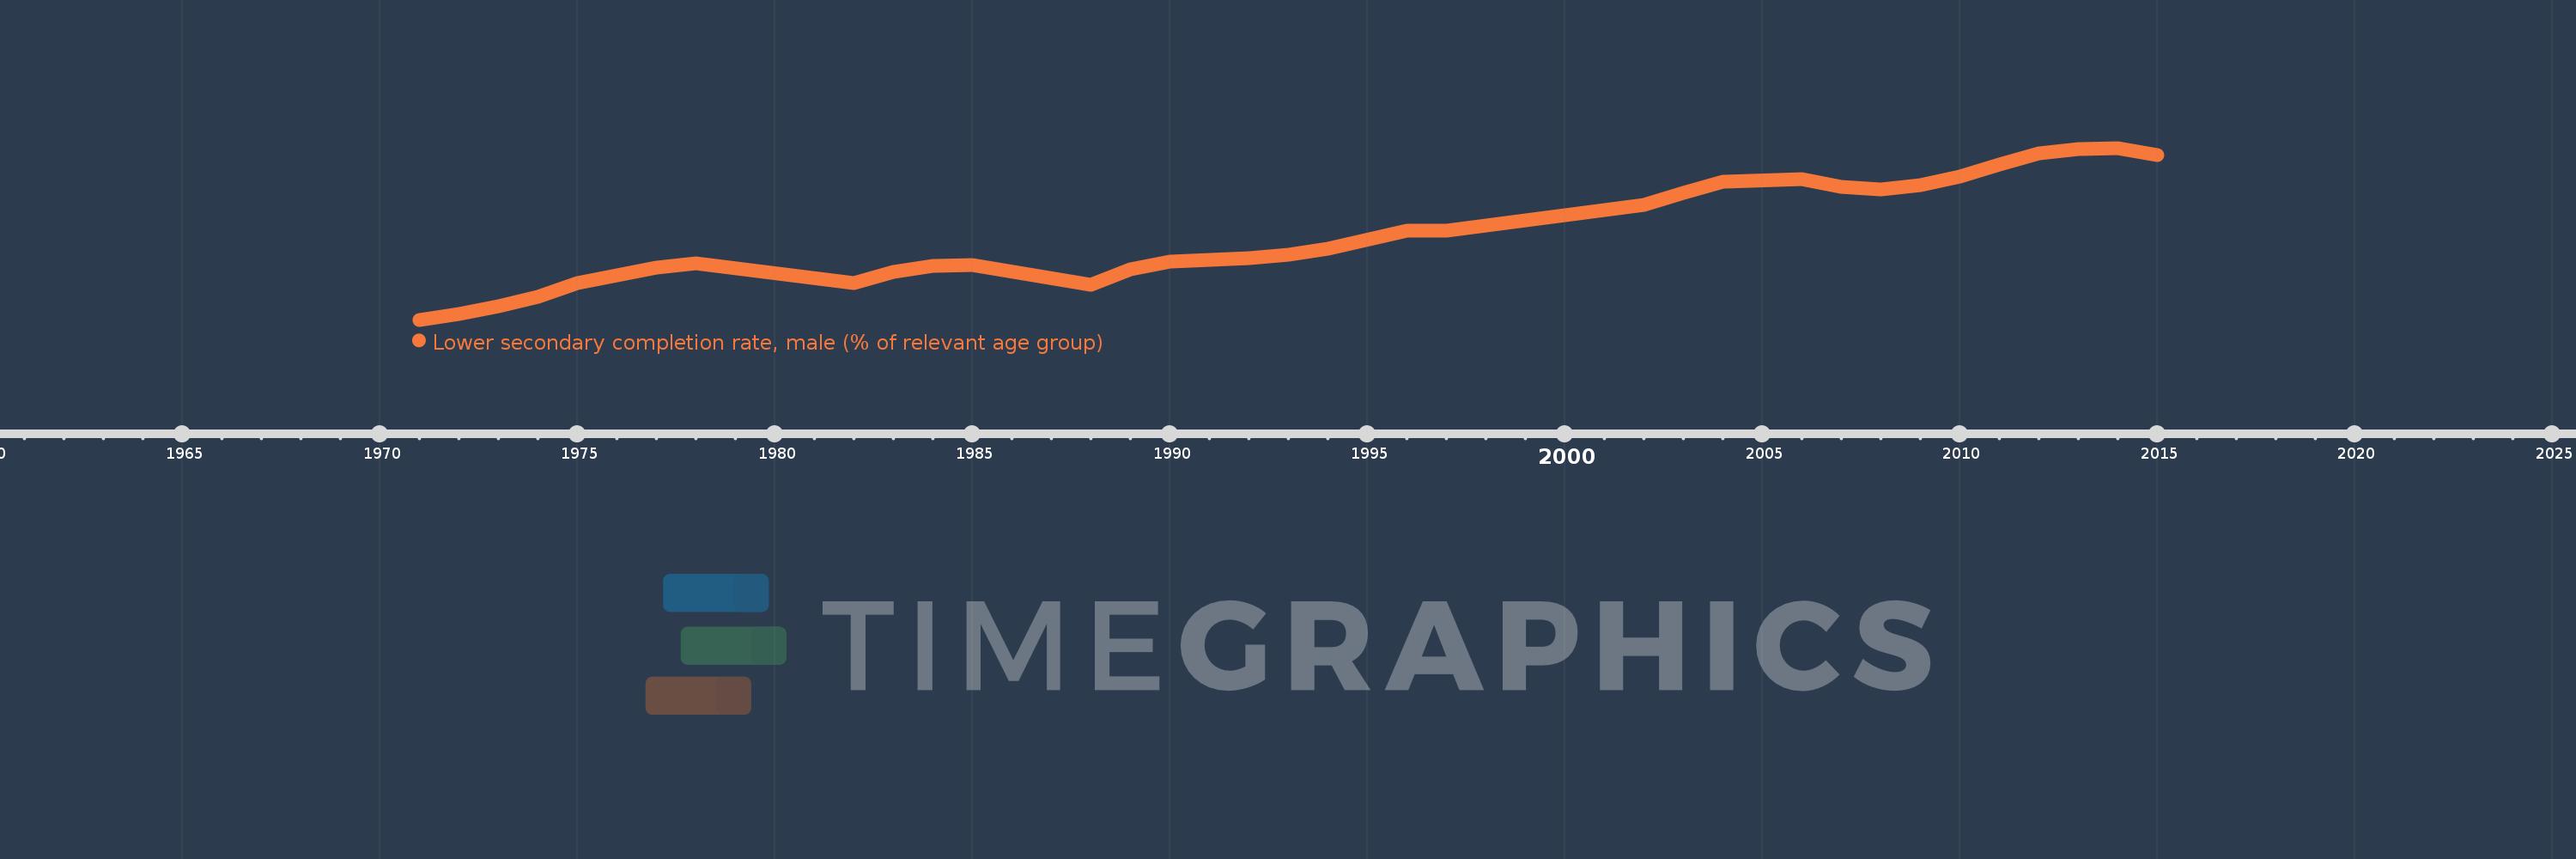
Lower secondary completion rate, male (% of relevant age group)
2015,2014,2013,2012,2011,2010,2009,2008,2007,2006,2004,2003,2002,1997,1996,1994,1993,1992,1990,1989,1988,1985,1984,1983,1982,1978,1977,1975,1974,1973,1972,1971
This statistics in other country:
AfghanistanAlbaniaAlgeriaAngolaAntigua and BarbudaArab WorldArgentinaArmeniaArubaAustriaAzerbaijanBahamas, TheBahrainBangladeshBarbadosBelarusBelgiumBelizeBeninBermudaBhutanBoliviaBosnia and HerzegovinaBotswanaBrunei DarussalamBulgariaBurkina FasoBurundiCabo VerdeCambodiaCameroonCaribbean small statesCentral African RepublicCentral Europe and the BalticsChadChileChinaColombiaComorosCongo, Dem. Rep.Congo, Rep.Costa RicaCote d'IvoireCroatiaCubaCyprusCzech RepublicDenmarkDjiboutiDominicaDominican RepublicEarly-demographic dividendEast Asia & PacificEast Asia & Pacific (excluding high income)East Asia & Pacific (IDA & IBRD countries)EcuadorEgypt, Arab Rep.El SalvadorEquatorial GuineaEritreaEstoniaEthiopiaEuro areaEurope & Central AsiaEurope & Central Asia (excluding high income)Europe & Central Asia (IDA & IBRD countries)European UnionFijiFinlandFragile and conflict affected situationsFranceGabonGambia, TheGeorgiaGermanyGhanaGreeceGrenadaGuatemalaGuineaGuinea-BissauGuyanaHaitiHeavily indebted poor countries (HIPC)High incomeHondurasHong Kong SAR, ChinaHungaryIBRD onlyIcelandIDA & IBRD totalIDA blendIDA onlyIDA totalIndiaIndonesiaIran, Islamic Rep.IraqIrelandIsraelItalyJamaicaJapanJordanKazakhstanKenyaKiribatiKorea, Dem. People’s Rep.Korea, Rep.KuwaitKyrgyz RepublicLao PDRLate-demographic dividendLatin America & Caribbean Latin America & Caribbean (excluding high income)Latin America & the Caribbean (IDA & IBRD countries)LatviaLeast developed countries: UN classificationLebanonLesothoLiberiaLiechtensteinLithuaniaLow & middle incomeLow incomeLower middle incomeLuxembourgMacao SAR, ChinaMacedonia, FYRMadagascarMalawiMaldivesMaliMaltaMarshall IslandsMauritaniaMauritiusMexicoMiddle East & North AfricaMiddle East & North Africa (excluding high income)Middle East & North Africa (IDA & IBRD countries)Middle incomeMoldovaMongoliaMontenegroMoroccoMozambiqueMyanmarNamibiaNauruNepalNetherlandsNicaraguaNigerNorwayOECD membersOmanOther small statesPacific island small statesPakistanPalauPanamaPapua New GuineaParaguayPeruPhilippinesPolandPortugalPost-demographic dividendPre-demographic dividendQatarRomaniaRussian FederationRwandaSamoaSan MarinoSao Tome and PrincipeSaudi ArabiaSenegalSerbiaSeychellesSierra LeoneSlovak RepublicSloveniaSmall statesSolomon IslandsSouth AfricaSouth AsiaSouth Asia (IDA & IBRD)South SudanSpainSri LankaSt. Kitts and NevisSt. LuciaSt. Vincent and the GrenadinesSub-Saharan Africa Sub-Saharan Africa (excluding high income)Sub-Saharan Africa (IDA & IBRD countries)SudanSurinameSwazilandSwedenSwitzerlandSyrian Arab RepublicTajikistanTanzaniaThailandTimor-LesteTogoTongaTrinidad and TobagoTunisiaTurkeyTuvaluUgandaUkraineUnited Arab EmiratesUpper middle incomeUruguayUzbekistanVanuatuVenezuela, RBVietnamWest Bank and GazaWorldYemen, Rep.ZambiaZimbabwe Timeline:
This timeline shows a graph from 1971 to 2015 of El Salvador. No data until 1970. Number of actual observations by date: 32.
Source name:
World Development Indicators
Source organization:
United Nations Educational, Scientific, and Cultural Organization (UNESCO) Institute for Statistics.
Categories, topics:
Education
Last updated:
apr 23, 2017
Indicators value changes by year
Minimum:
17.535
jan 1, 1971
Maximum:
86.581
jan 1, 2014
At the date of observation
Value
Absolute change
Change from previous value
jan 1, 1971
17.535
+17.535
0.0%
jan 1, 1972
19.784
+2.249
12.83%
jan 1, 1973
22.995
+3.21
16.23%
jan 1, 1974
26.599
+3.604
15.68%
jan 1, 1975
32.126
+5.527
20.78%
jan 1, 1977
38.401
+6.274
19.53%
jan 1, 1978
40.255
+1.855
4.83%
jan 1, 1982
32.123
-8.132
-20.2%
jan 1, 1983
36.641
+4.518
14.06%
jan 1, 1984
39.184
+2.543
6.94%
jan 1, 1985
39.642
+0.458
1.17%
jan 1, 1988
31.743
-7.899
-19.93%
jan 1, 1989
37.661
+5.918
18.64%
jan 1, 1990
40.927
+3.266
8.67%
jan 1, 1992
42.195
+1.268
3.1%
jan 1, 1993
43.614
+1.42
3.36%
jan 1, 1994
46.002
+2.388
5.47%
jan 1, 1996
53.35
+7.348
15.97%
jan 1, 1997
53.465
+0.114
0.21%
jan 1, 2002
63.578
+10.114
18.92%
jan 1, 2003
68.435
+4.857
7.64%
jan 1, 2004
73.094
+4.659
6.81%
jan 1, 2006
73.885
+0.791
1.08%
jan 1, 2007
70.884
-3.001
-4.06%
jan 1, 2008
69.96
-0.923
-1.3%
jan 1, 2009
71.702
+1.741
2.49%
jan 1, 2010
74.997
+3.296
4.6%
jan 1, 2011
79.916
+4.918
6.56%
jan 1, 2012
84.474
+4.559
5.7%
jan 1, 2013
86.006
+1.532
1.81%
jan 1, 2014
86.581
+0.574
0.67%
jan 1, 2015
83.728
-2.853
-3.29%
Ranking of countries by current statistics by years


Comments: