29
/
en
AIzaSyAYiBZKx7MnpbEhh9jyipgxe19OcubqV5w
April 1, 2024
191624
Malta
MLT
true
2
1
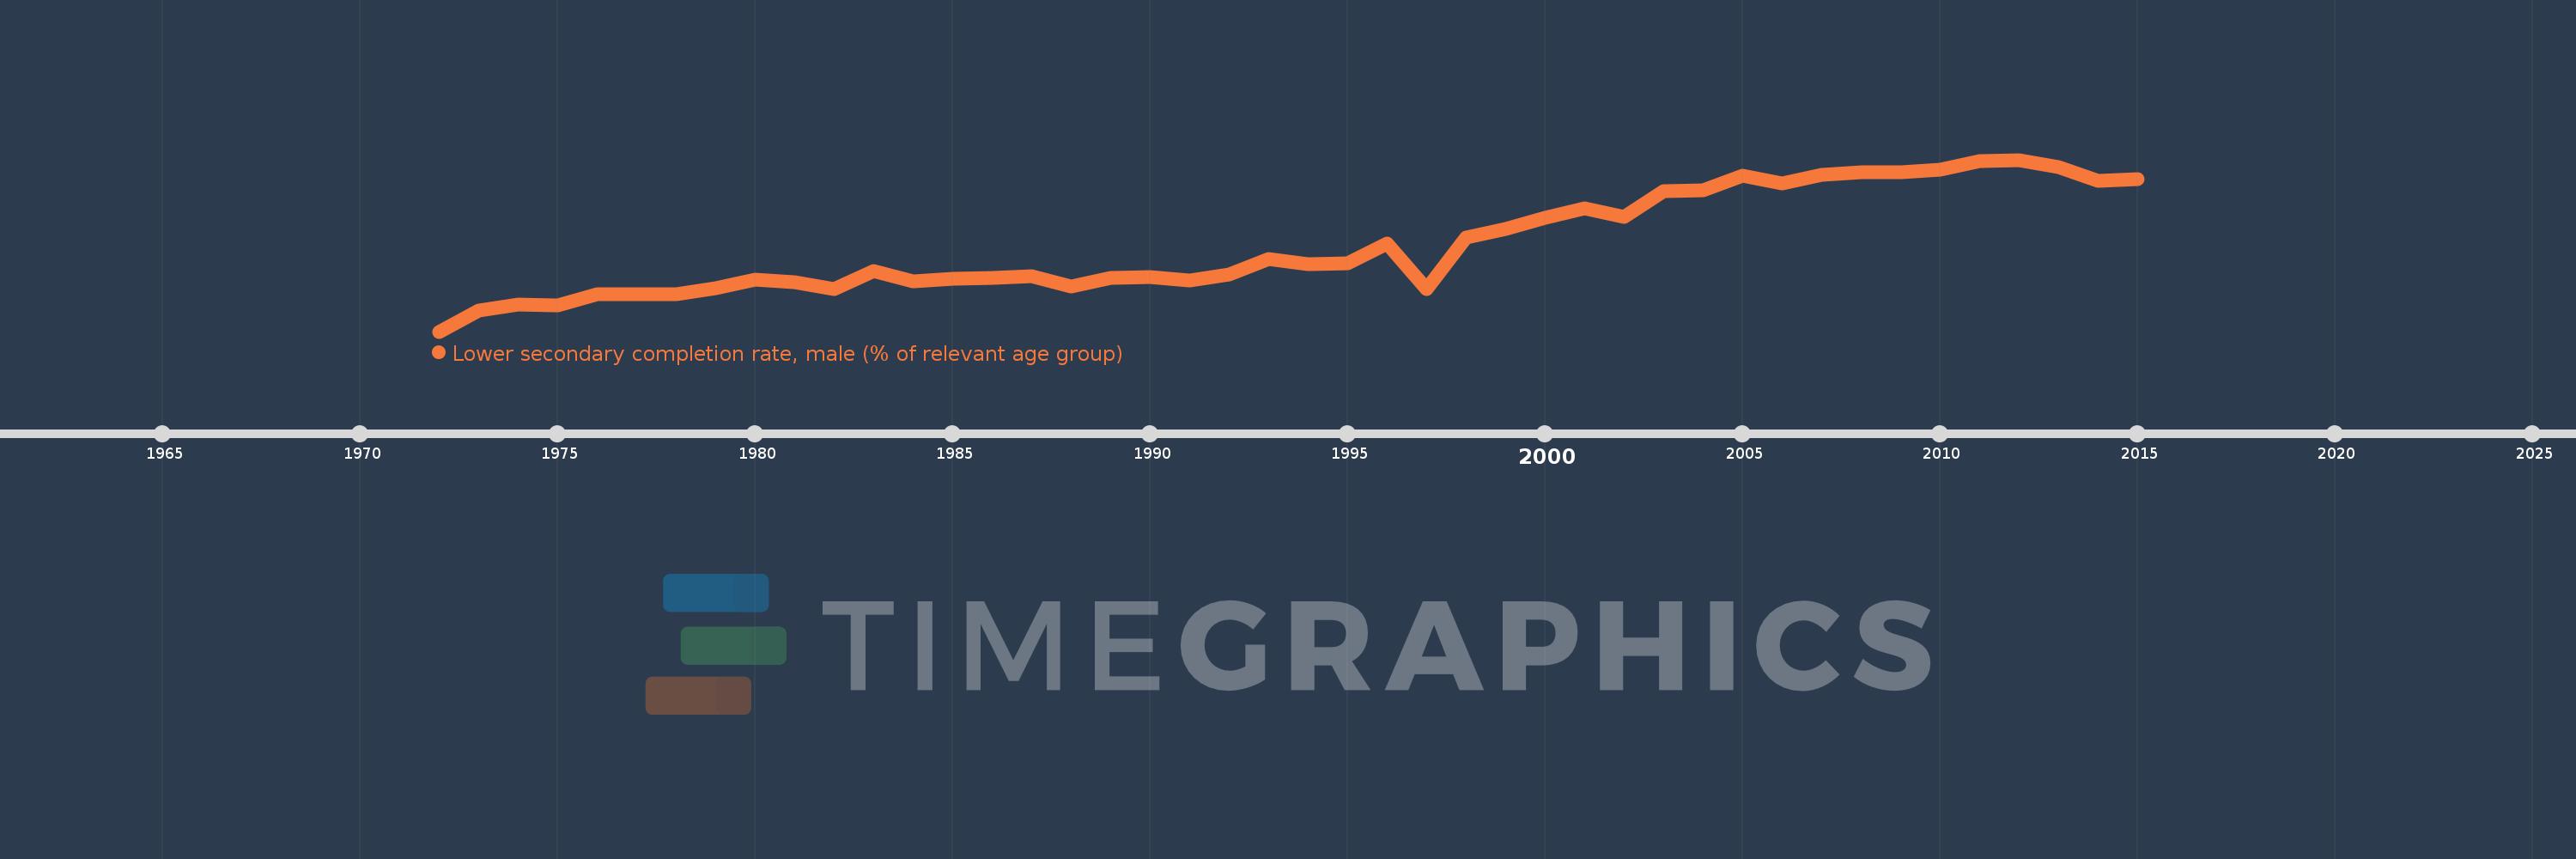
Lower secondary completion rate, male (% of relevant age group)
2015,2014,2013,2012,2011,2010,2009,2008,2007,2006,2005,2004,2003,2002,2001,2000,1999,1998,1997,1996,1995,1994,1993,1992,1991,1990,1989,1988,1987,1986,1985,1984,1983,1982,1981,1980,1979,1978,1977,1976,1975,1974,1973,1972
This statistics in other country:
AfghanistanAlbaniaAlgeriaAngolaAntigua and BarbudaArab WorldArgentinaArmeniaArubaAustriaAzerbaijanBahamas, TheBahrainBangladeshBarbadosBelarusBelgiumBelizeBeninBermudaBhutanBoliviaBosnia and HerzegovinaBotswanaBrunei DarussalamBulgariaBurkina FasoBurundiCabo VerdeCambodiaCameroonCaribbean small statesCentral African RepublicCentral Europe and the BalticsChadChileChinaColombiaComorosCongo, Dem. Rep.Congo, Rep.Costa RicaCote d'IvoireCroatiaCubaCyprusCzech RepublicDenmarkDjiboutiDominicaDominican RepublicEarly-demographic dividendEast Asia & PacificEast Asia & Pacific (excluding high income)East Asia & Pacific (IDA & IBRD countries)EcuadorEgypt, Arab Rep.El SalvadorEquatorial GuineaEritreaEstoniaEthiopiaEuro areaEurope & Central AsiaEurope & Central Asia (excluding high income)Europe & Central Asia (IDA & IBRD countries)European UnionFijiFinlandFragile and conflict affected situationsFranceGabonGambia, TheGeorgiaGermanyGhanaGreeceGrenadaGuatemalaGuineaGuinea-BissauGuyanaHaitiHeavily indebted poor countries (HIPC)High incomeHondurasHong Kong SAR, ChinaHungaryIBRD onlyIcelandIDA & IBRD totalIDA blendIDA onlyIDA totalIndiaIndonesiaIran, Islamic Rep.IraqIrelandIsraelItalyJamaicaJapanJordanKazakhstanKenyaKiribatiKorea, Dem. People’s Rep.Korea, Rep.KuwaitKyrgyz RepublicLao PDRLate-demographic dividendLatin America & Caribbean Latin America & Caribbean (excluding high income)Latin America & the Caribbean (IDA & IBRD countries)LatviaLeast developed countries: UN classificationLebanonLesothoLiberiaLiechtensteinLithuaniaLow & middle incomeLow incomeLower middle incomeLuxembourgMacao SAR, ChinaMacedonia, FYRMadagascarMalawiMaldivesMaliMaltaMarshall IslandsMauritaniaMauritiusMexicoMiddle East & North AfricaMiddle East & North Africa (excluding high income)Middle East & North Africa (IDA & IBRD countries)Middle incomeMoldovaMongoliaMontenegroMoroccoMozambiqueMyanmarNamibiaNauruNepalNetherlandsNicaraguaNigerNorwayOECD membersOmanOther small statesPacific island small statesPakistanPalauPanamaPapua New GuineaParaguayPeruPhilippinesPolandPortugalPost-demographic dividendPre-demographic dividendQatarRomaniaRussian FederationRwandaSamoaSan MarinoSao Tome and PrincipeSaudi ArabiaSenegalSerbiaSeychellesSierra LeoneSlovak RepublicSloveniaSmall statesSolomon IslandsSouth AfricaSouth AsiaSouth Asia (IDA & IBRD)South SudanSpainSri LankaSt. Kitts and NevisSt. LuciaSt. Vincent and the GrenadinesSub-Saharan Africa Sub-Saharan Africa (excluding high income)Sub-Saharan Africa (IDA & IBRD countries)SudanSurinameSwazilandSwedenSwitzerlandSyrian Arab RepublicTajikistanTanzaniaThailandTimor-LesteTogoTongaTrinidad and TobagoTunisiaTurkeyTuvaluUgandaUkraineUnited Arab EmiratesUpper middle incomeUruguayUzbekistanVanuatuVenezuela, RBVietnamWest Bank and GazaWorldYemen, Rep.ZambiaZimbabwe Timeline:
This timeline shows a graph from 1972 to 2015 of Malta. No data until 1971. Number of actual observations by date: 44.
Source name:
World Development Indicators
Source organization:
United Nations Educational, Scientific, and Cultural Organization (UNESCO) Institute for Statistics.
Categories, topics:
Education
Last updated:
apr 23, 2017
Indicators value changes by year
Minimum:
16.938
jan 1, 1972
Maximum:
103.505
jan 1, 2012
At the date of observation
Value
Absolute change
Change from previous value
jan 1, 1972
16.938
+16.938
0.0%
jan 1, 1973
27.397
+10.458
61.74%
jan 1, 1974
30.756
+3.359
12.26%
jan 1, 1975
29.955
-0.802
-2.61%
jan 1, 1976
35.941
+5.987
19.99%
jan 1, 1977
35.666
-0.275
-0.77%
jan 1, 1978
35.825
+0.159
0.45%
jan 1, 1979
39.004
+3.179
8.87%
jan 1, 1980
43.14
+4.136
10.6%
jan 1, 1981
41.988
-1.152
-2.67%
jan 1, 1982
38.167
-3.821
-9.1%
jan 1, 1983
47.432
+9.266
24.28%
jan 1, 1984
42.259
-5.174
-10.91%
jan 1, 1985
43.344
+1.085
2.57%
jan 1, 1986
44.158
+0.814
1.88%
jan 1, 1987
44.696
+0.538
1.22%
jan 1, 1988
39.667
-5.029
-11.25%
jan 1, 1989
43.94
+4.273
10.77%
jan 1, 1990
44.436
+0.496
1.13%
jan 1, 1991
42.868
-1.568
-3.53%
jan 1, 1992
45.86
+2.992
6.98%
jan 1, 1993
53.653
+7.793
16.99%
jan 1, 1994
50.976
-2.677
-4.99%
jan 1, 1995
51.421
+0.445
0.87%
jan 1, 1996
61.18
+9.758
18.98%
jan 1, 1997
38.265
-22.914
-37.45%
jan 1, 1998
64.467
+26.202
68.47%
jan 1, 1999
68.789
+4.322
6.7%
jan 1, 2000
74.302
+5.513
8.01%
jan 1, 2001
79.06
+4.758
6.4%
jan 1, 2002
74.648
-4.412
-5.58%
jan 1, 2003
87.521
+12.873
17.24%
jan 1, 2004
88.007
+0.486
0.55%
jan 1, 2005
95.386
+7.379
8.38%
jan 1, 2006
91.584
-3.802
-3.99%
jan 1, 2007
95.938
+4.354
4.75%
jan 1, 2008
97.144
+1.206
1.26%
jan 1, 2009
97.088
-0.056
-0.06%
jan 1, 2010
98.714
+1.626
1.67%
jan 1, 2011
102.842
+4.128
4.18%
jan 1, 2012
103.505
+0.663
0.64%
jan 1, 2013
99.677
-3.828
-3.7%
jan 1, 2014
92.943
-6.734
-6.76%
jan 1, 2015
93.688
+0.745
0.8%
Ranking of countries by current statistics by years


Comments: