29
/
en
AIzaSyAYiBZKx7MnpbEhh9jyipgxe19OcubqV5w
April 1, 2024
268246
Tunisia
TUN
true
2
1
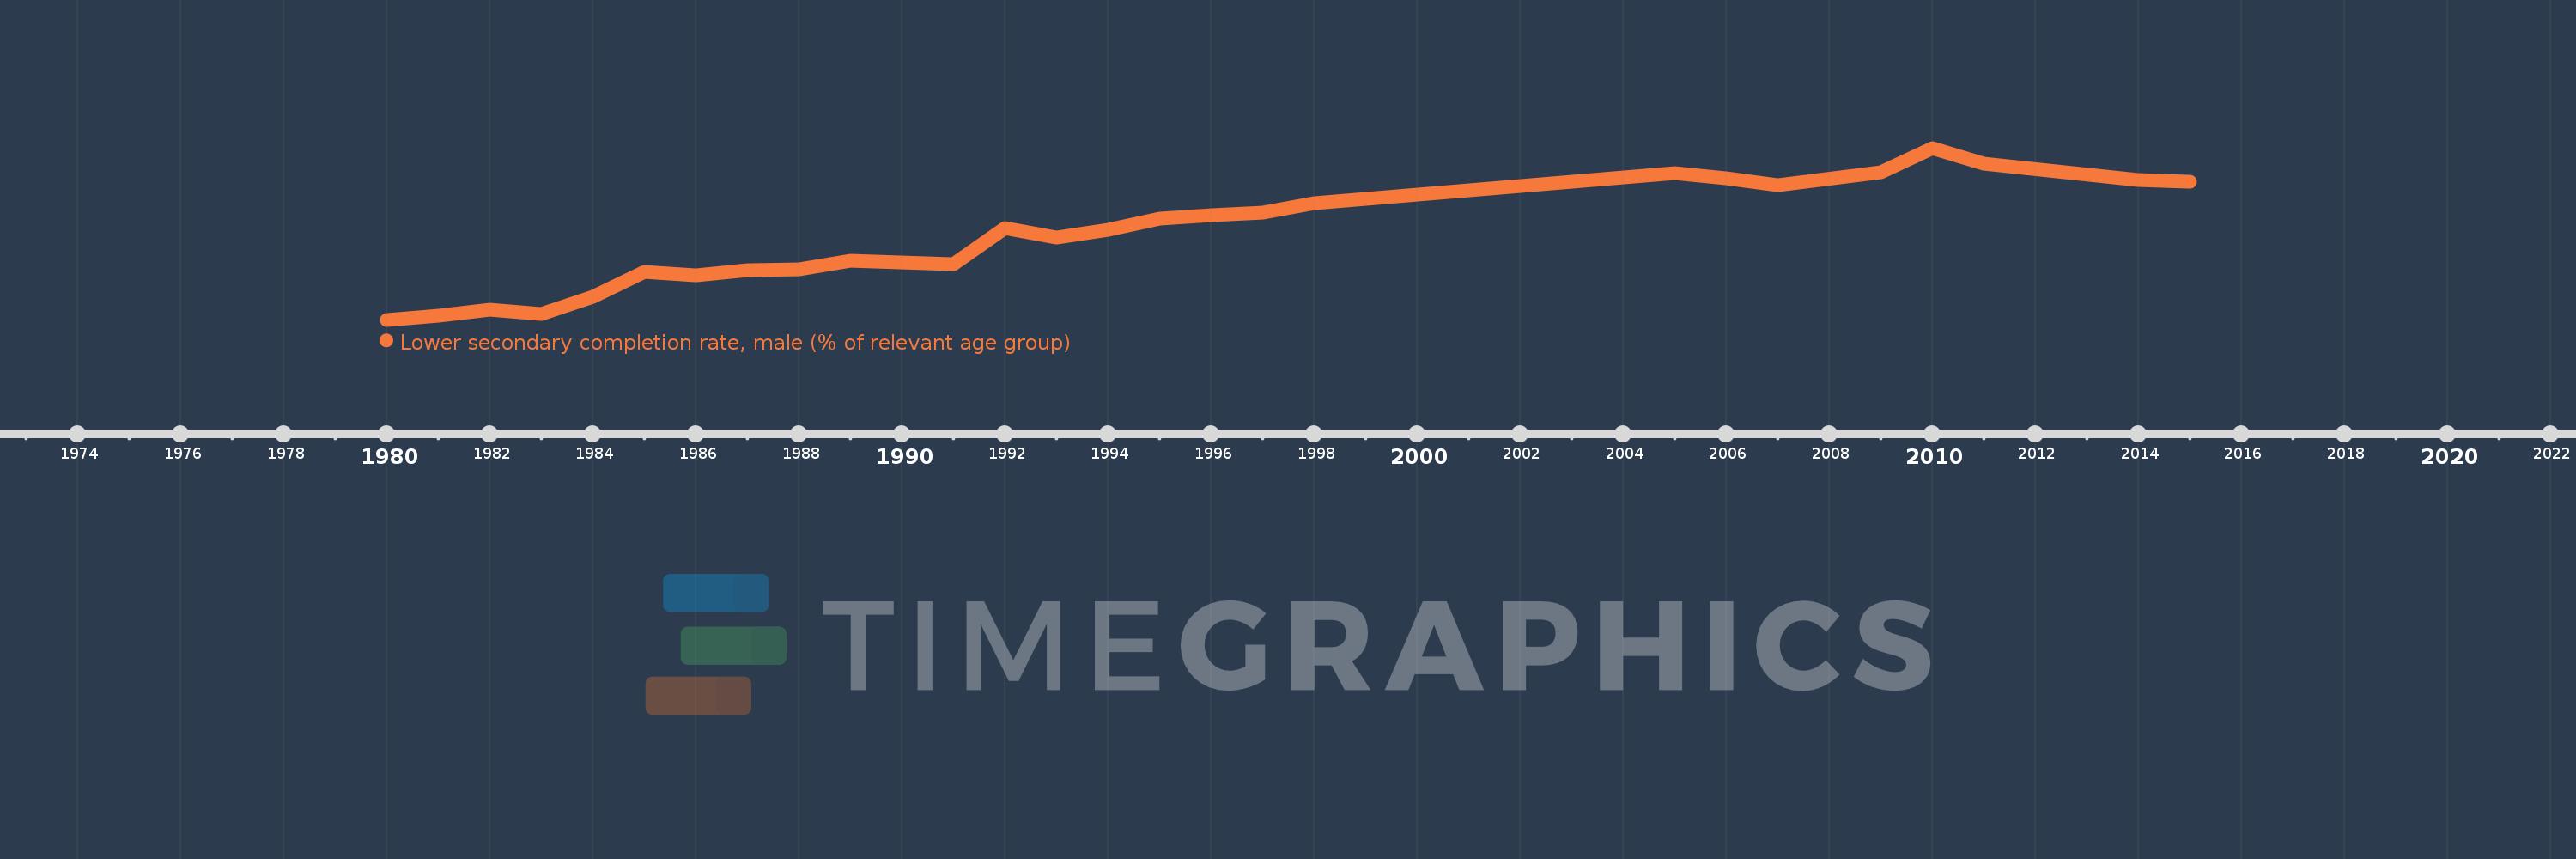
Lower secondary completion rate, male (% of relevant age group)
2015,2014,2011,2010,2009,2007,2006,2005,1998,1997,1996,1995,1994,1993,1992,1991,1989,1988,1987,1986,1985,1984,1983,1982,1981,1980
This statistics in other country:
AfghanistanAlbaniaAlgeriaAngolaAntigua and BarbudaArab WorldArgentinaArmeniaArubaAustriaAzerbaijanBahamas, TheBahrainBangladeshBarbadosBelarusBelgiumBelizeBeninBermudaBhutanBoliviaBosnia and HerzegovinaBotswanaBrunei DarussalamBulgariaBurkina FasoBurundiCabo VerdeCambodiaCameroonCaribbean small statesCentral African RepublicCentral Europe and the BalticsChadChileChinaColombiaComorosCongo, Dem. Rep.Congo, Rep.Costa RicaCote d'IvoireCroatiaCubaCyprusCzech RepublicDenmarkDjiboutiDominicaDominican RepublicEarly-demographic dividendEast Asia & PacificEast Asia & Pacific (excluding high income)East Asia & Pacific (IDA & IBRD countries)EcuadorEgypt, Arab Rep.El SalvadorEquatorial GuineaEritreaEstoniaEthiopiaEuro areaEurope & Central AsiaEurope & Central Asia (excluding high income)Europe & Central Asia (IDA & IBRD countries)European UnionFijiFinlandFragile and conflict affected situationsFranceGabonGambia, TheGeorgiaGermanyGhanaGreeceGrenadaGuatemalaGuineaGuinea-BissauGuyanaHaitiHeavily indebted poor countries (HIPC)High incomeHondurasHong Kong SAR, ChinaHungaryIBRD onlyIcelandIDA & IBRD totalIDA blendIDA onlyIDA totalIndiaIndonesiaIran, Islamic Rep.IraqIrelandIsraelItalyJamaicaJapanJordanKazakhstanKenyaKiribatiKorea, Dem. People’s Rep.Korea, Rep.KuwaitKyrgyz RepublicLao PDRLate-demographic dividendLatin America & Caribbean Latin America & Caribbean (excluding high income)Latin America & the Caribbean (IDA & IBRD countries)LatviaLeast developed countries: UN classificationLebanonLesothoLiberiaLiechtensteinLithuaniaLow & middle incomeLow incomeLower middle incomeLuxembourgMacao SAR, ChinaMacedonia, FYRMadagascarMalawiMaldivesMaliMaltaMarshall IslandsMauritaniaMauritiusMexicoMiddle East & North AfricaMiddle East & North Africa (excluding high income)Middle East & North Africa (IDA & IBRD countries)Middle incomeMoldovaMongoliaMontenegroMoroccoMozambiqueMyanmarNamibiaNauruNepalNetherlandsNicaraguaNigerNorwayOECD membersOmanOther small statesPacific island small statesPakistanPalauPanamaPapua New GuineaParaguayPeruPhilippinesPolandPortugalPost-demographic dividendPre-demographic dividendQatarRomaniaRussian FederationRwandaSamoaSan MarinoSao Tome and PrincipeSaudi ArabiaSenegalSerbiaSeychellesSierra LeoneSlovak RepublicSloveniaSmall statesSolomon IslandsSouth AfricaSouth AsiaSouth Asia (IDA & IBRD)South SudanSpainSri LankaSt. Kitts and NevisSt. LuciaSt. Vincent and the GrenadinesSub-Saharan Africa Sub-Saharan Africa (excluding high income)Sub-Saharan Africa (IDA & IBRD countries)SudanSurinameSwazilandSwedenSwitzerlandSyrian Arab RepublicTajikistanTanzaniaThailandTimor-LesteTogoTongaTrinidad and TobagoTunisiaTurkeyTuvaluUgandaUkraineUnited Arab EmiratesUpper middle incomeUruguayUzbekistanVanuatuVenezuela, RBVietnamWest Bank and GazaWorldYemen, Rep.ZambiaZimbabwe Timeline:
This timeline shows a graph from 1980 to 2015 of Tunisia. No data until 1979. Number of actual observations by date: 26.
Source name:
World Development Indicators
Source organization:
United Nations Educational, Scientific, and Cultural Organization (UNESCO) Institute for Statistics.
Categories, topics:
Education
Last updated:
apr 23, 2017
Indicators value changes by year
Minimum:
20.433
jan 1, 1980
Maximum:
72.192
jan 1, 2010
At the date of observation
Value
Absolute change
Change from previous value
jan 1, 1980
20.433
+20.433
0.0%
jan 1, 1981
21.692
+1.258
6.16%
jan 1, 1982
23.559
+1.867
8.61%
jan 1, 1983
22.123
-1.436
-6.09%
jan 1, 1984
27.282
+5.159
23.32%
jan 1, 1985
34.743
+7.461
27.35%
jan 1, 1986
33.777
-0.966
-2.78%
jan 1, 1987
35.381
+1.604
4.75%
jan 1, 1988
35.671
+0.29
0.82%
jan 1, 1989
38.336
+2.665
7.47%
jan 1, 1991
37.214
-1.121
-2.93%
jan 1, 1992
48.162
+10.948
29.42%
jan 1, 1993
45.113
-3.049
-6.33%
jan 1, 1994
47.569
+2.456
5.44%
jan 1, 1995
50.948
+3.379
7.1%
jan 1, 1996
51.841
+0.892
1.75%
jan 1, 1997
52.665
+0.825
1.59%
jan 1, 1998
55.621
+2.955
5.61%
jan 1, 2005
64.482
+8.861
15.93%
jan 1, 2006
63.062
-1.419
-2.2%
jan 1, 2007
60.965
-2.097
-3.33%
jan 1, 2009
64.904
+3.938
6.46%
jan 1, 2010
72.192
+7.289
11.23%
jan 1, 2011
67.474
-4.718
-6.54%
jan 1, 2014
62.441
-5.033
-7.46%
jan 1, 2015
62.043
-0.398
-0.64%
Ranking of countries by current statistics by years


Comments: