30
/
AIzaSyAYiBZKx7MnpbEhh9jyipgxe19OcubqV5w
April 1, 2024
170175
Korea, Rep.
KOR
true
2
1
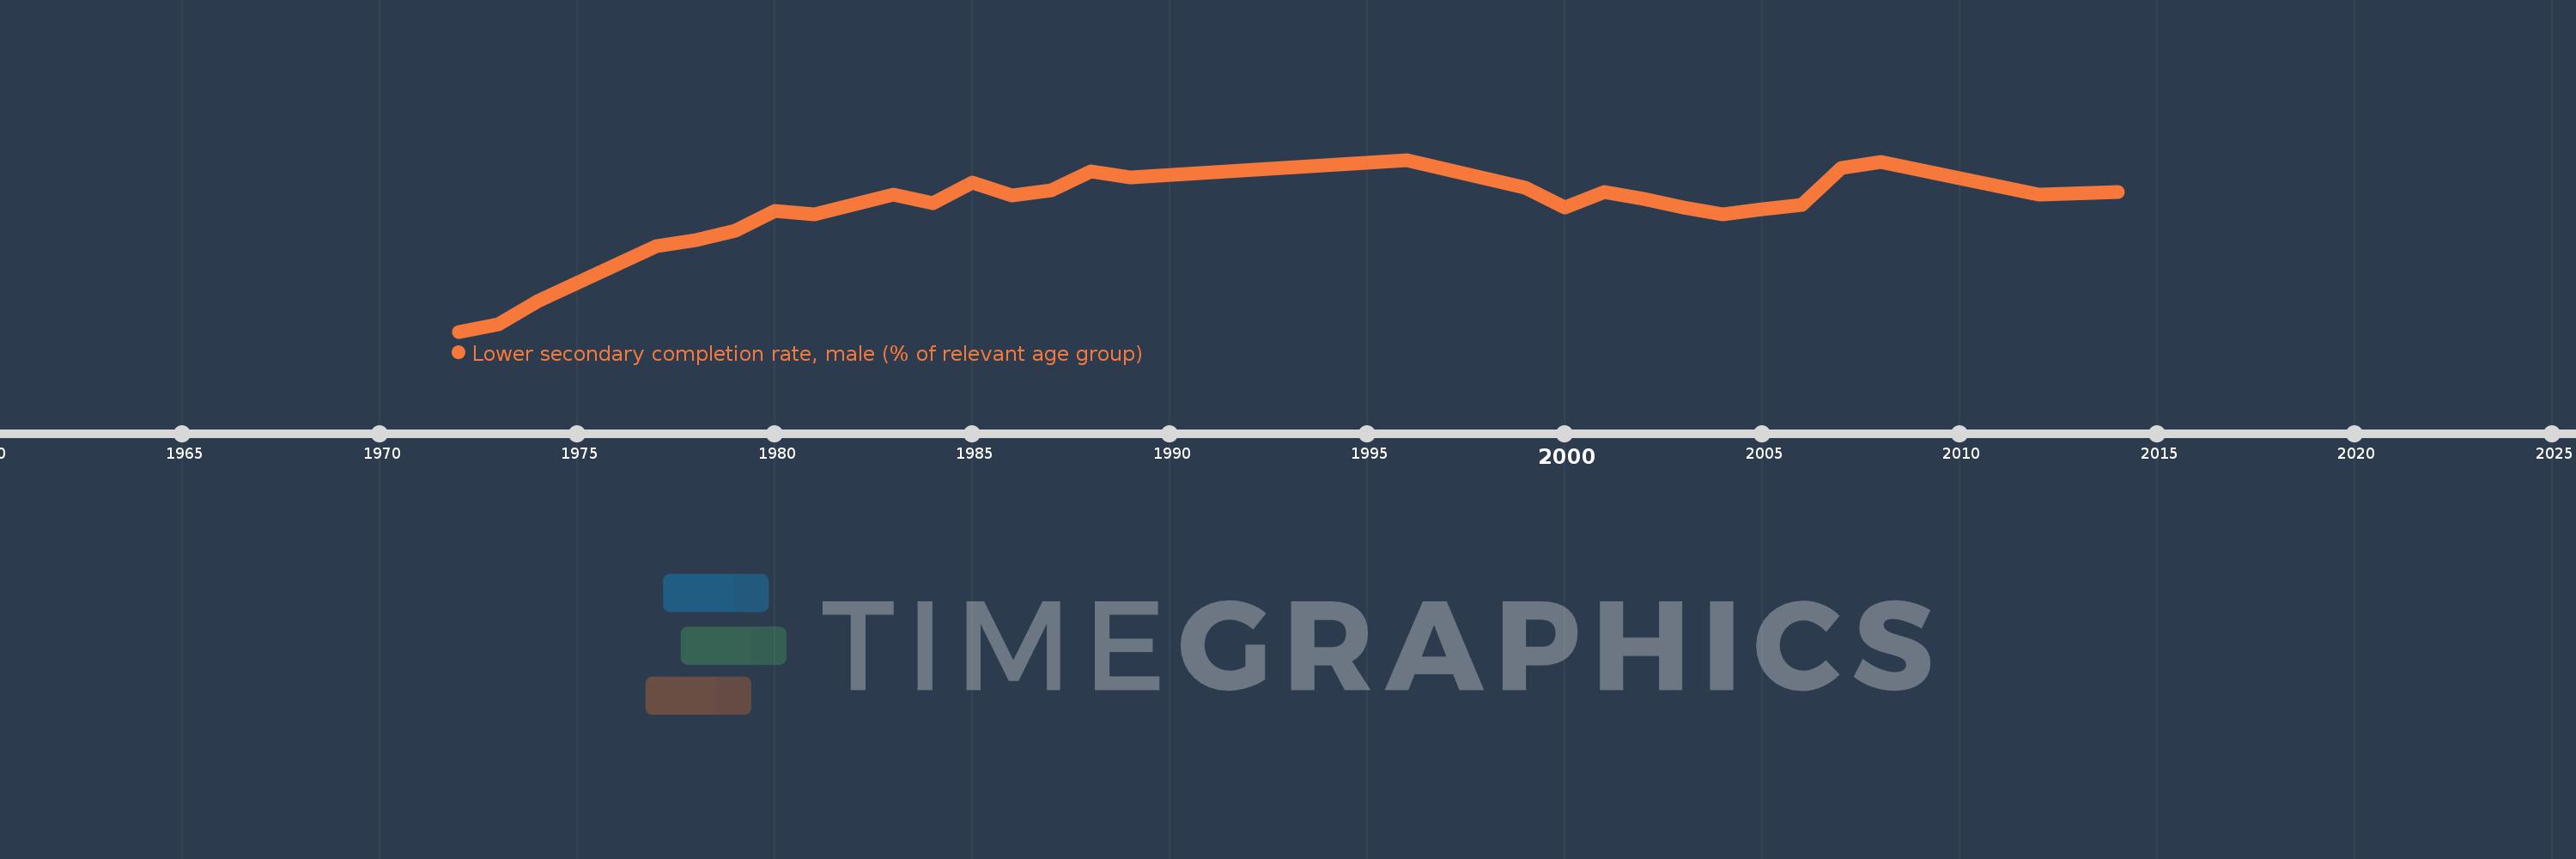
Lower secondary completion rate, male (% of relevant age group)
2014,2012,2008,2007,2006,2005,2004,2003,2002,2001,2000,1999,1996,1989,1988,1987,1986,1985,1984,1983,1981,1980,1979,1978,1977,1974,1973,1972
