29
/
en
AIzaSyAYiBZKx7MnpbEhh9jyipgxe19OcubqV5w
April 1, 2024
39172
IDA only
IDX
false
2
1
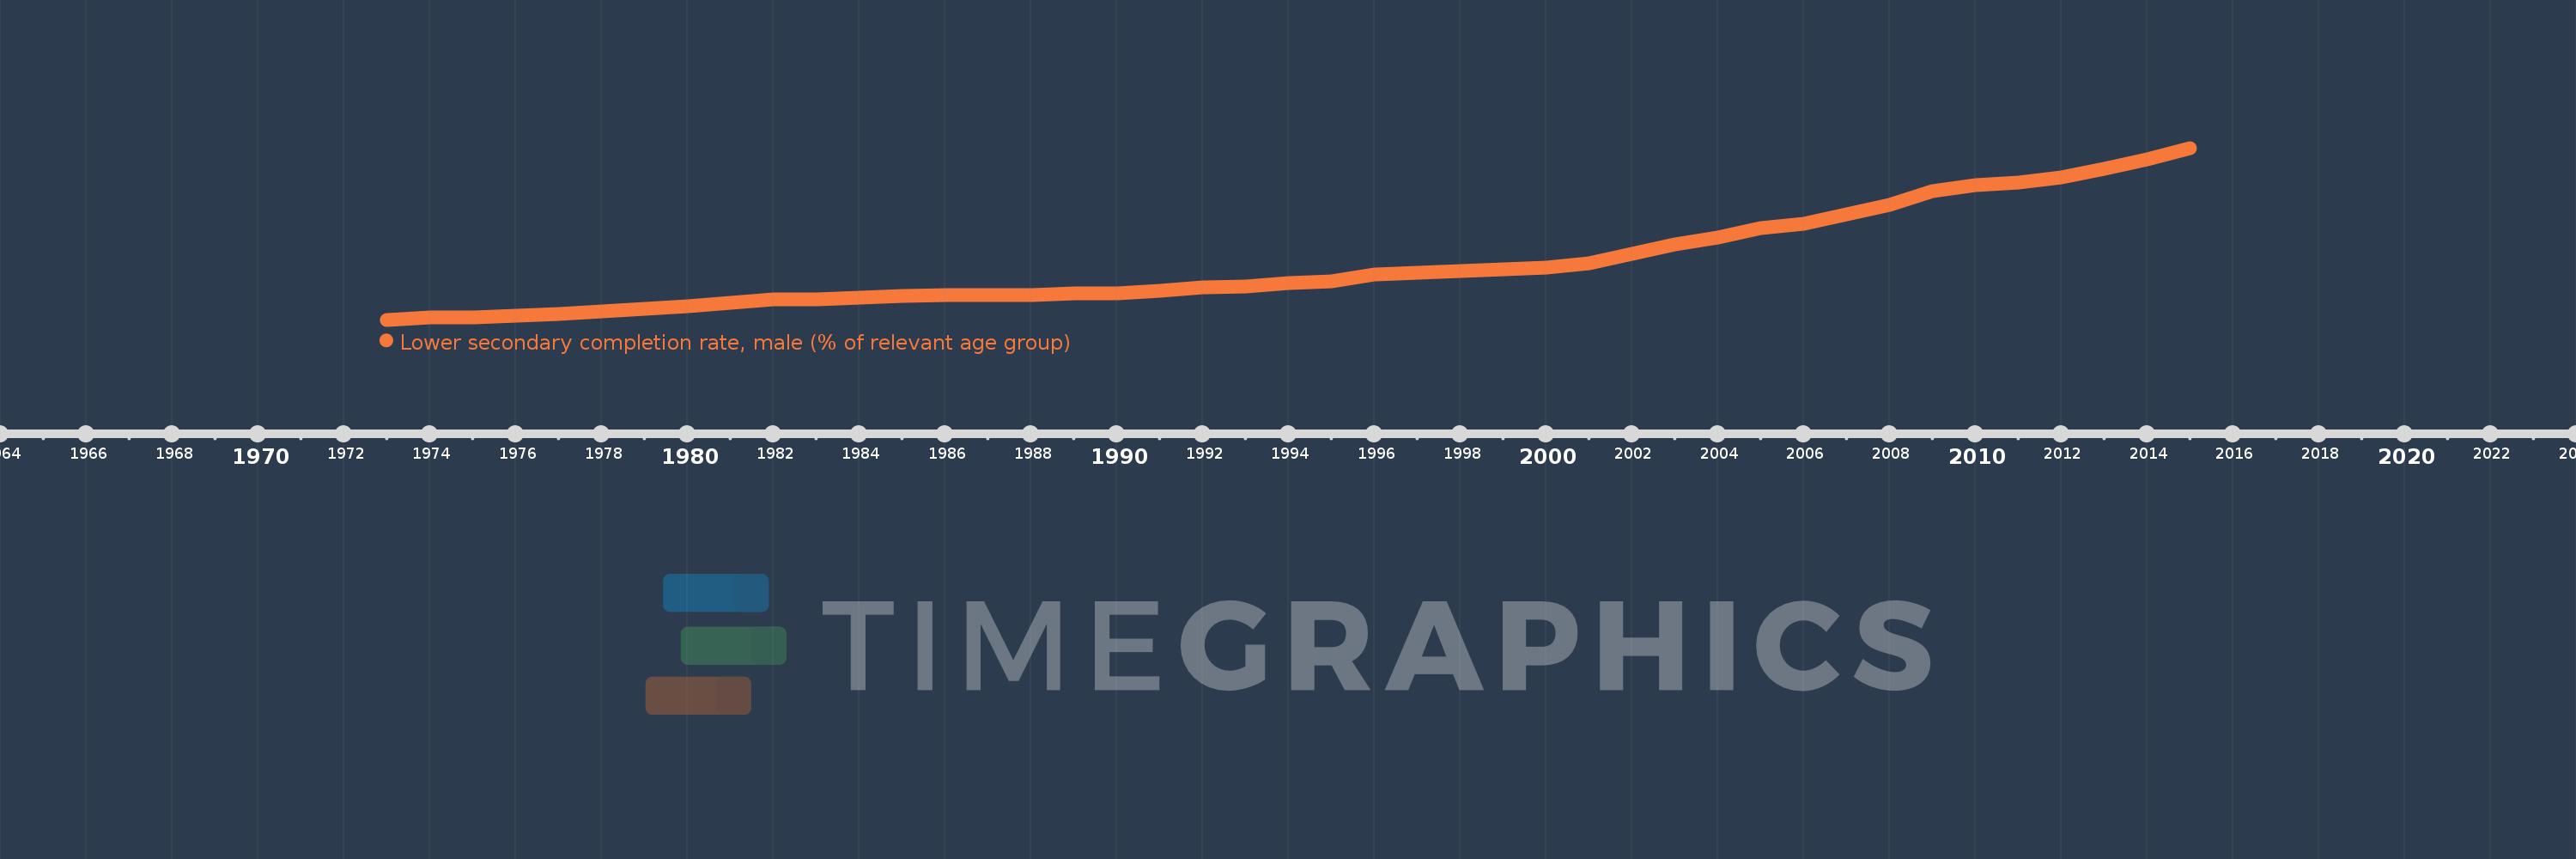
Lower secondary completion rate, male (% of relevant age group)
2015,2014,2013,2012,2011,2010,2009,2008,2007,2006,2005,2004,2003,2002,2001,2000,1999,1998,1997,1996,1995,1994,1993,1992,1991,1990,1989,1988,1987,1986,1985,1984,1983,1982,1981,1980,1979,1978,1977,1976,1975,1974,1973
This statistics in other country:
AfghanistanAlbaniaAlgeriaAngolaAntigua and BarbudaArab WorldArgentinaArmeniaArubaAustriaAzerbaijanBahamas, TheBahrainBangladeshBarbadosBelarusBelgiumBelizeBeninBermudaBhutanBoliviaBosnia and HerzegovinaBotswanaBrunei DarussalamBulgariaBurkina FasoBurundiCabo VerdeCambodiaCameroonCaribbean small statesCentral African RepublicCentral Europe and the BalticsChadChileChinaColombiaComorosCongo, Dem. Rep.Congo, Rep.Costa RicaCote d'IvoireCroatiaCubaCyprusCzech RepublicDenmarkDjiboutiDominicaDominican RepublicEarly-demographic dividendEast Asia & PacificEast Asia & Pacific (excluding high income)East Asia & Pacific (IDA & IBRD countries)EcuadorEgypt, Arab Rep.El SalvadorEquatorial GuineaEritreaEstoniaEthiopiaEuro areaEurope & Central AsiaEurope & Central Asia (excluding high income)Europe & Central Asia (IDA & IBRD countries)European UnionFijiFinlandFragile and conflict affected situationsFranceGabonGambia, TheGeorgiaGermanyGhanaGreeceGrenadaGuatemalaGuineaGuinea-BissauGuyanaHaitiHeavily indebted poor countries (HIPC)High incomeHondurasHong Kong SAR, ChinaHungaryIBRD onlyIcelandIDA & IBRD totalIDA blendIDA onlyIDA totalIndiaIndonesiaIran, Islamic Rep.IraqIrelandIsraelItalyJamaicaJapanJordanKazakhstanKenyaKiribatiKorea, Dem. People’s Rep.Korea, Rep.KuwaitKyrgyz RepublicLao PDRLate-demographic dividendLatin America & Caribbean Latin America & Caribbean (excluding high income)Latin America & the Caribbean (IDA & IBRD countries)LatviaLeast developed countries: UN classificationLebanonLesothoLiberiaLiechtensteinLithuaniaLow & middle incomeLow incomeLower middle incomeLuxembourgMacao SAR, ChinaMacedonia, FYRMadagascarMalawiMaldivesMaliMaltaMarshall IslandsMauritaniaMauritiusMexicoMiddle East & North AfricaMiddle East & North Africa (excluding high income)Middle East & North Africa (IDA & IBRD countries)Middle incomeMoldovaMongoliaMontenegroMoroccoMozambiqueMyanmarNamibiaNauruNepalNetherlandsNicaraguaNigerNorwayOECD membersOmanOther small statesPacific island small statesPakistanPalauPanamaPapua New GuineaParaguayPeruPhilippinesPolandPortugalPost-demographic dividendPre-demographic dividendQatarRomaniaRussian FederationRwandaSamoaSan MarinoSao Tome and PrincipeSaudi ArabiaSenegalSerbiaSeychellesSierra LeoneSlovak RepublicSloveniaSmall statesSolomon IslandsSouth AfricaSouth AsiaSouth Asia (IDA & IBRD)South SudanSpainSri LankaSt. Kitts and NevisSt. LuciaSt. Vincent and the GrenadinesSub-Saharan Africa Sub-Saharan Africa (excluding high income)Sub-Saharan Africa (IDA & IBRD countries)SudanSurinameSwazilandSwedenSwitzerlandSyrian Arab RepublicTajikistanTanzaniaThailandTimor-LesteTogoTongaTrinidad and TobagoTunisiaTurkeyTuvaluUgandaUkraineUnited Arab EmiratesUpper middle incomeUruguayUzbekistanVanuatuVenezuela, RBVietnamWest Bank and GazaWorldYemen, Rep.ZambiaZimbabwe Timeline:
This timeline shows a graph from 1973 to 2015 of IDA only. No data until 1972. Number of actual observations by date: 43.
Source name:
World Development Indicators
Source organization:
United Nations Educational, Scientific, and Cultural Organization (UNESCO) Institute for Statistics.
Categories, topics:
Education
Last updated:
apr 23, 2017
Indicators value changes by year
Minimum:
26.845
jan 1, 1973
Maximum:
47.798
jan 1, 2015
At the date of observation
Value
Absolute change
Change from previous value
jan 1, 1973
26.845
+26.845
0.0%
jan 1, 1974
27.1
+0.255
0.95%
jan 1, 1975
27.146
+0.046
0.17%
jan 1, 1976
27.356
+0.21
0.77%
jan 1, 1977
27.548
+0.191
0.7%
jan 1, 1978
27.853
+0.306
1.11%
jan 1, 1979
28.212
+0.359
1.29%
jan 1, 1980
28.444
+0.231
0.82%
jan 1, 1981
28.958
+0.514
1.81%
jan 1, 1982
29.278
+0.319
1.1%
jan 1, 1983
29.29
+0.012
0.04%
jan 1, 1984
29.492
+0.202
0.69%
jan 1, 1985
29.706
+0.214
0.72%
jan 1, 1986
29.878
+0.173
0.58%
jan 1, 1987
29.881
+0.003
0.01%
jan 1, 1988
29.814
-0.067
-0.23%
jan 1, 1989
30.016
+0.203
0.68%
jan 1, 1990
30.026
+0.01
0.03%
jan 1, 1991
30.347
+0.32
1.07%
jan 1, 1992
30.763
+0.417
1.37%
jan 1, 1993
30.882
+0.119
0.39%
jan 1, 1994
31.37
+0.487
1.58%
jan 1, 1995
31.565
+0.195
0.62%
jan 1, 1996
32.376
+0.811
2.57%
jan 1, 1997
32.57
+0.194
0.6%
jan 1, 1998
32.79
+0.22
0.68%
jan 1, 1999
33.026
+0.236
0.72%
jan 1, 2000
33.216
+0.19
0.57%
jan 1, 2001
33.681
+0.465
1.4%
jan 1, 2002
34.894
+1.213
3.6%
jan 1, 2003
36.031
+1.137
3.26%
jan 1, 2004
36.842
+0.812
2.25%
jan 1, 2005
38.026
+1.184
3.21%
jan 1, 2006
38.561
+0.535
1.41%
jan 1, 2007
39.674
+1.113
2.89%
jan 1, 2008
40.837
+1.164
2.93%
jan 1, 2009
42.531
+1.694
4.15%
jan 1, 2010
43.219
+0.688
1.62%
jan 1, 2011
43.563
+0.345
0.8%
jan 1, 2012
44.253
+0.689
1.58%
jan 1, 2013
45.296
+1.044
2.36%
jan 1, 2014
46.427
+1.131
2.5%
jan 1, 2015
47.798
+1.371
2.95%
Ranking of countries by current statistics by years


Comments: