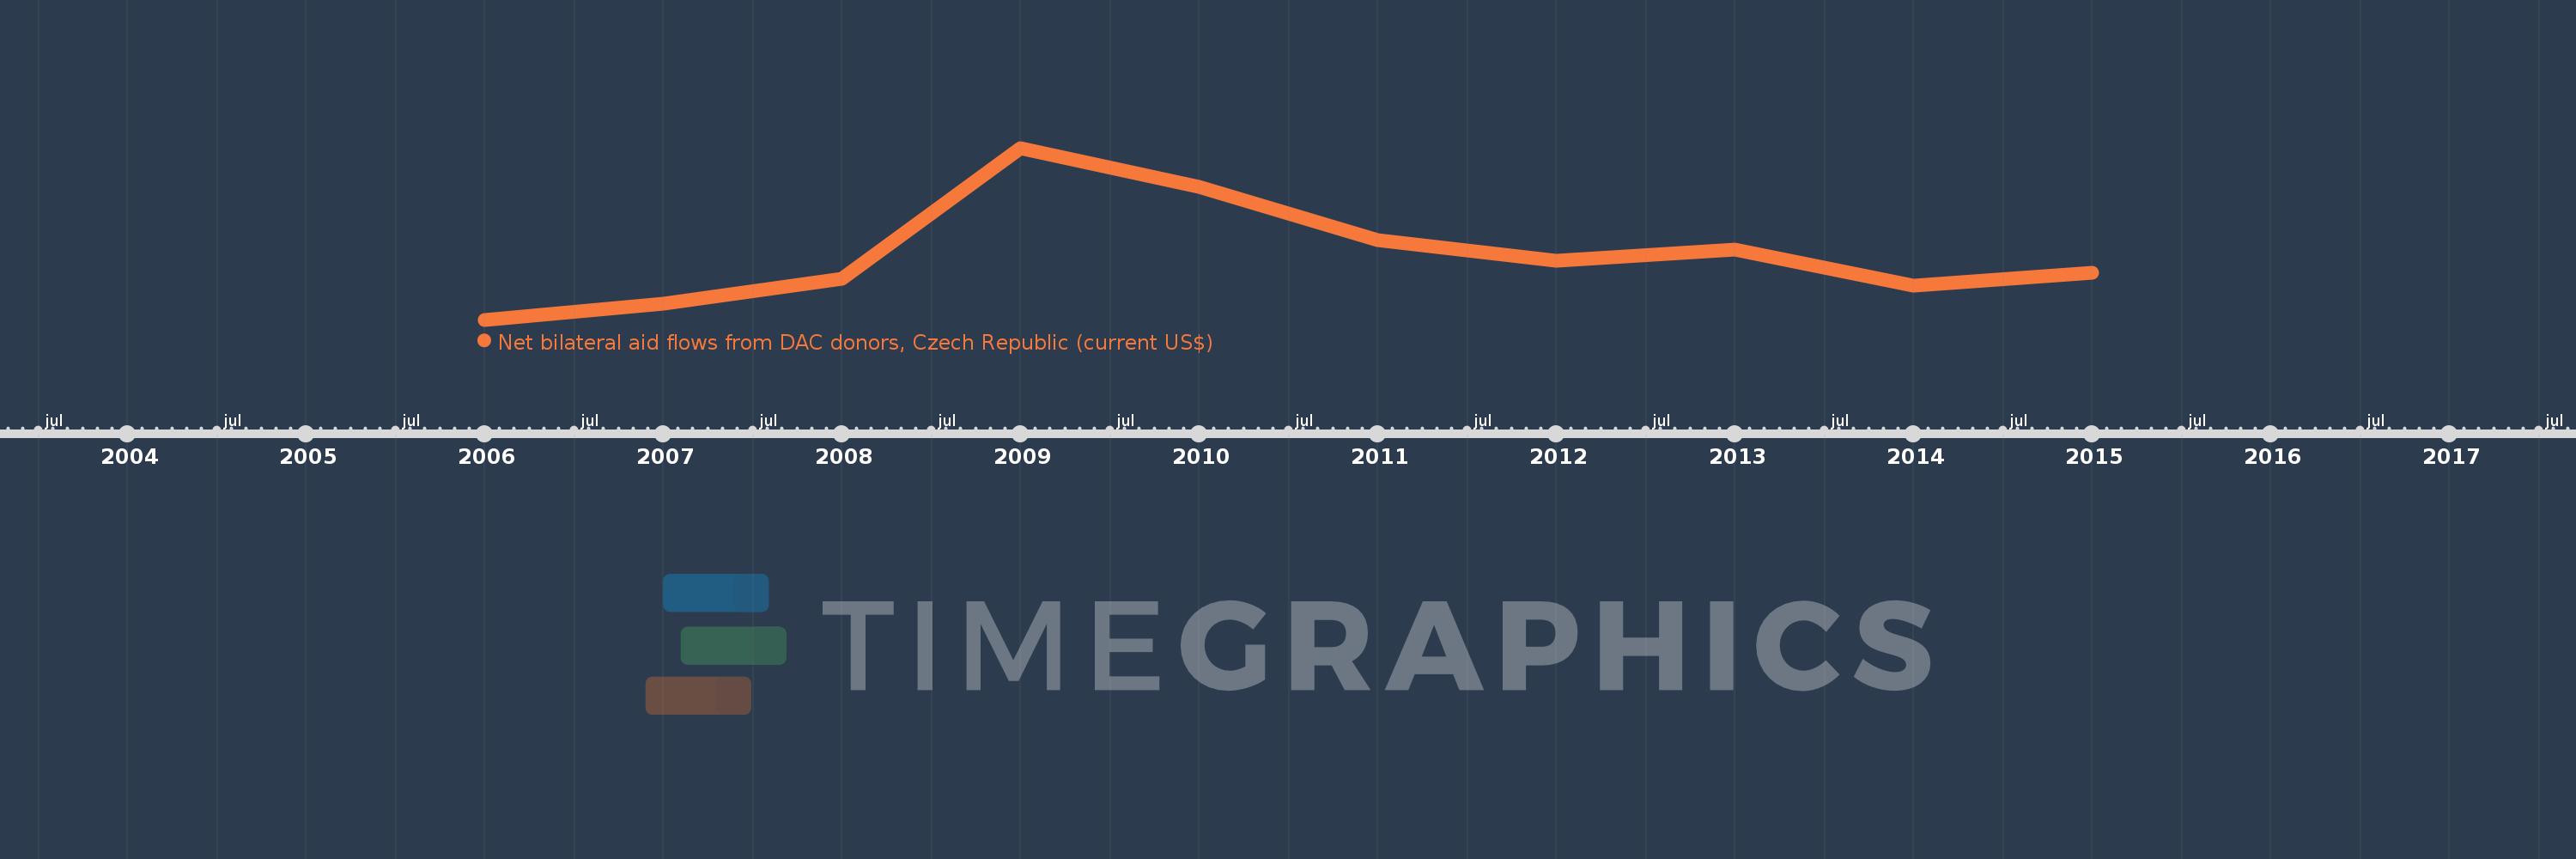
This timeline shows a graph from 2006 to 2015 of IDA only. No data until 2005. Number of actual observations by date: 10.
Source name:
World Development Indicators
Source organization:
Development Assistance Committee of the Organisation for Economic Co-operation and Development, Geographical Distribution of Financial Flows to Developing Countries, Development Co-operation
Categories, topics:
Aid Effectiveness
Last updated:
apr 23, 2017
Indicators value changes by year
Meaning:
23.943 mln
Minimum:
6.1 mln
jan 1, 2006
Maximum:
53.1 mln
jan 1, 2009
At the date of observation
Value
Absolute change
Change from the previous value
jan 1, 2006
6.1 mln
+6.1 mln
0.0%
jan 1, 2007
10.59 mln
+4.49 mln
73.61%
jan 1, 2008
17.3 mln
+6.71 mln
63.36%
jan 1, 2009
53.1 mln
+35.8 mln
206.94%
jan 1, 2010
42.54 mln
-10.56 mln
-19.89%
jan 1, 2011
27.95 mln
-14.59 mln
-34.3%
jan 1, 2012
22.18 mln
-5.77 mln
-20.64%
jan 1, 2013
25.36 mln
+3.18 mln
14.34%
jan 1, 2014
15.45 mln
-9.91 mln
-39.08%
jan 1, 2015
18.86 mln
+3.41 mln
22.07%
Ranking of countries by current statistics by years
