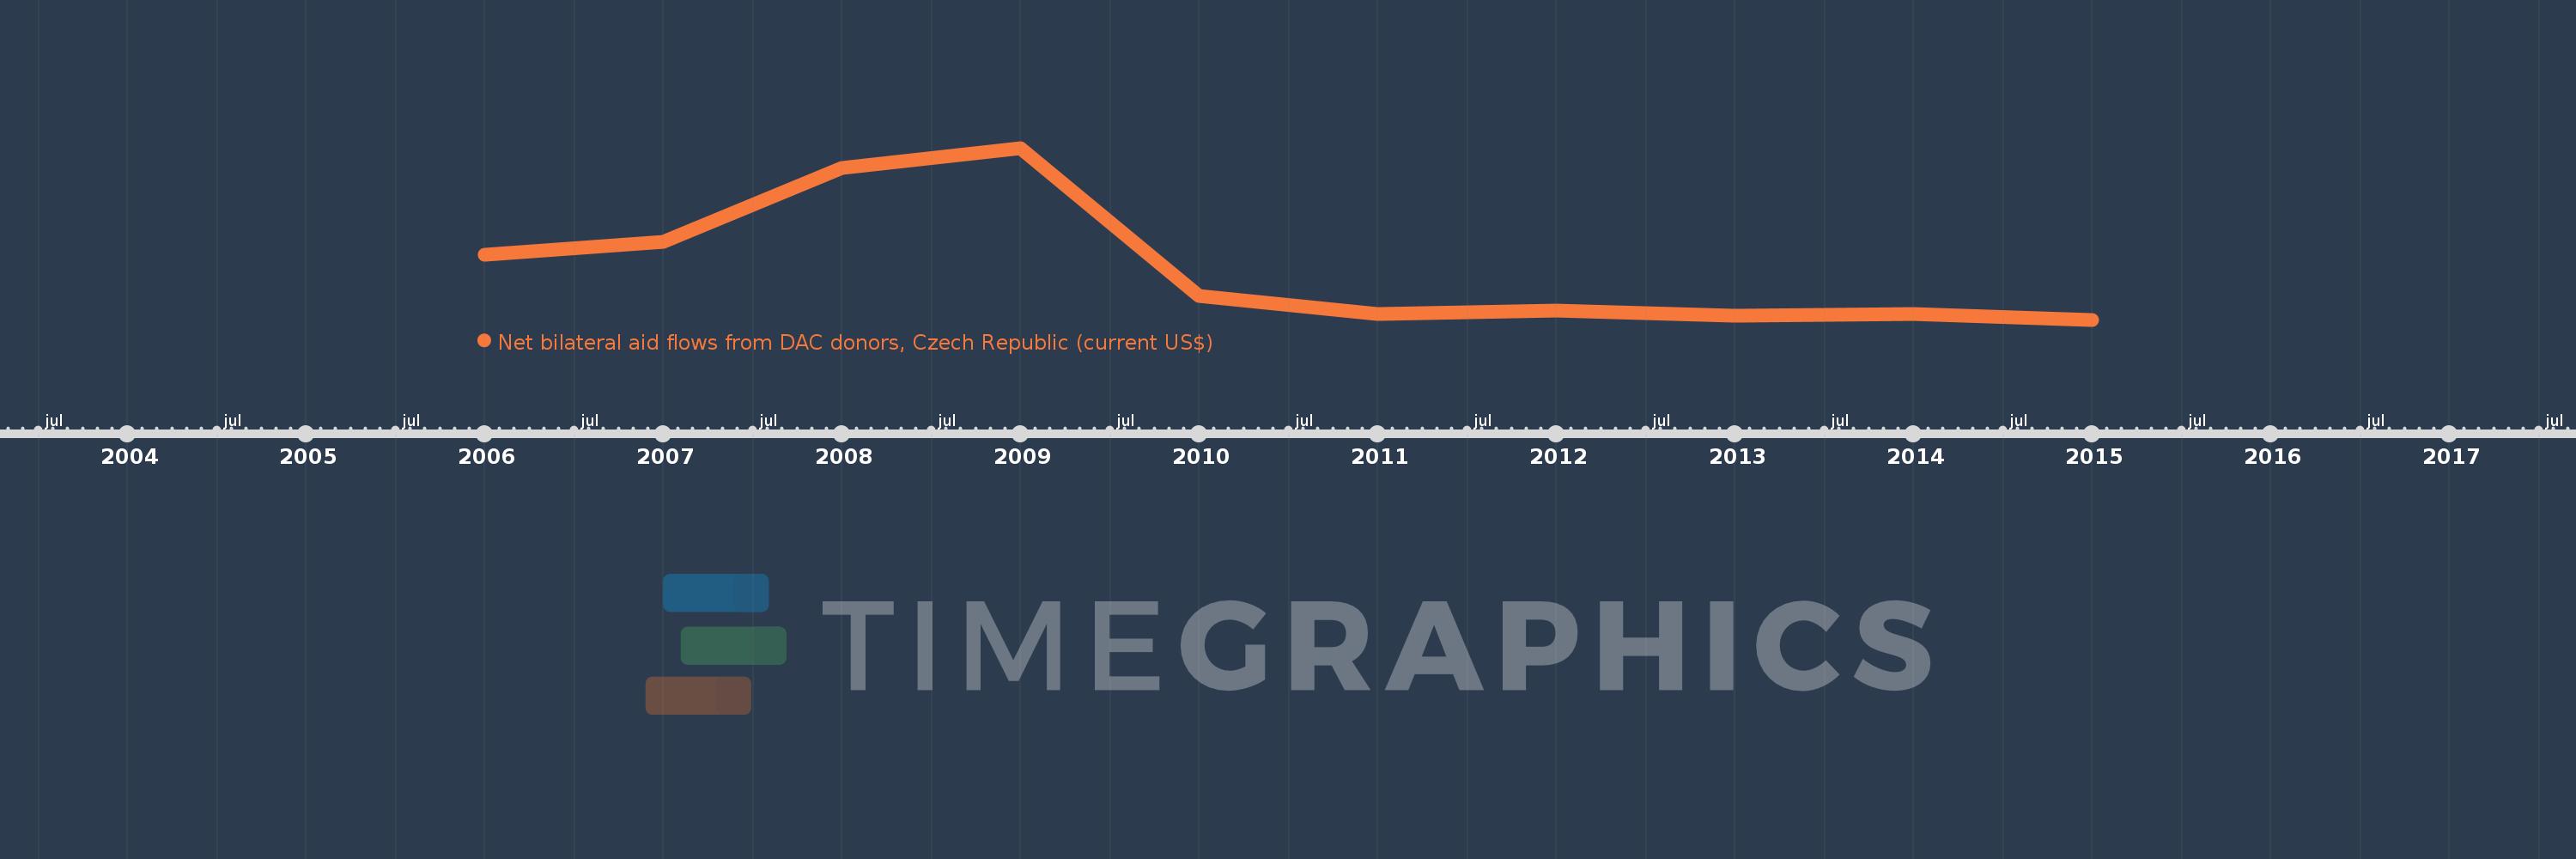
This timeline shows a graph from 2006 to 2015 of Namibia. No data until 2005. Number of actual observations by date: 10.
Source name:
World Development Indicators
Source organization:
Development Assistance Committee of the Organisation for Economic Co-operation and Development, Geographical Distribution of Financial Flows to Developing Countries, Development Co-operation
Categories, topics:
Aid Effectiveness
Last updated:
apr 23, 2017
Indicators value changes by year
Meaning:
394.0K
Minimum:
110.0K
jan 1, 2015
Maximum:
1.06 mln
jan 1, 2009
At the date of observation
Value
Absolute change
Change from the previous value
jan 1, 2006
470.0K
+470.0K
0.0%
jan 1, 2007
540.0K
+70.0K
14.89%
jan 1, 2008
950.0K
+410.0K
75.93%
jan 1, 2009
1.06 mln
+110.0K
11.58%
jan 1, 2010
240.0K
-820.0K
-77.36%
jan 1, 2011
140.0K
-100.0K
-41.67%
jan 1, 2012
160.0K
+20.0K
14.29%
jan 1, 2013
130.0K
-30.0K
-18.75%
jan 1, 2014
140.0K
+10.0K
7.69%
jan 1, 2015
110.0K
-30.0K
-21.43%
Ranking of countries by current statistics by years
