29
/
en
AIzaSyAYiBZKx7MnpbEhh9jyipgxe19OcubqV5w
April 1, 2024
115113
Croatia
HRV
true
2
1
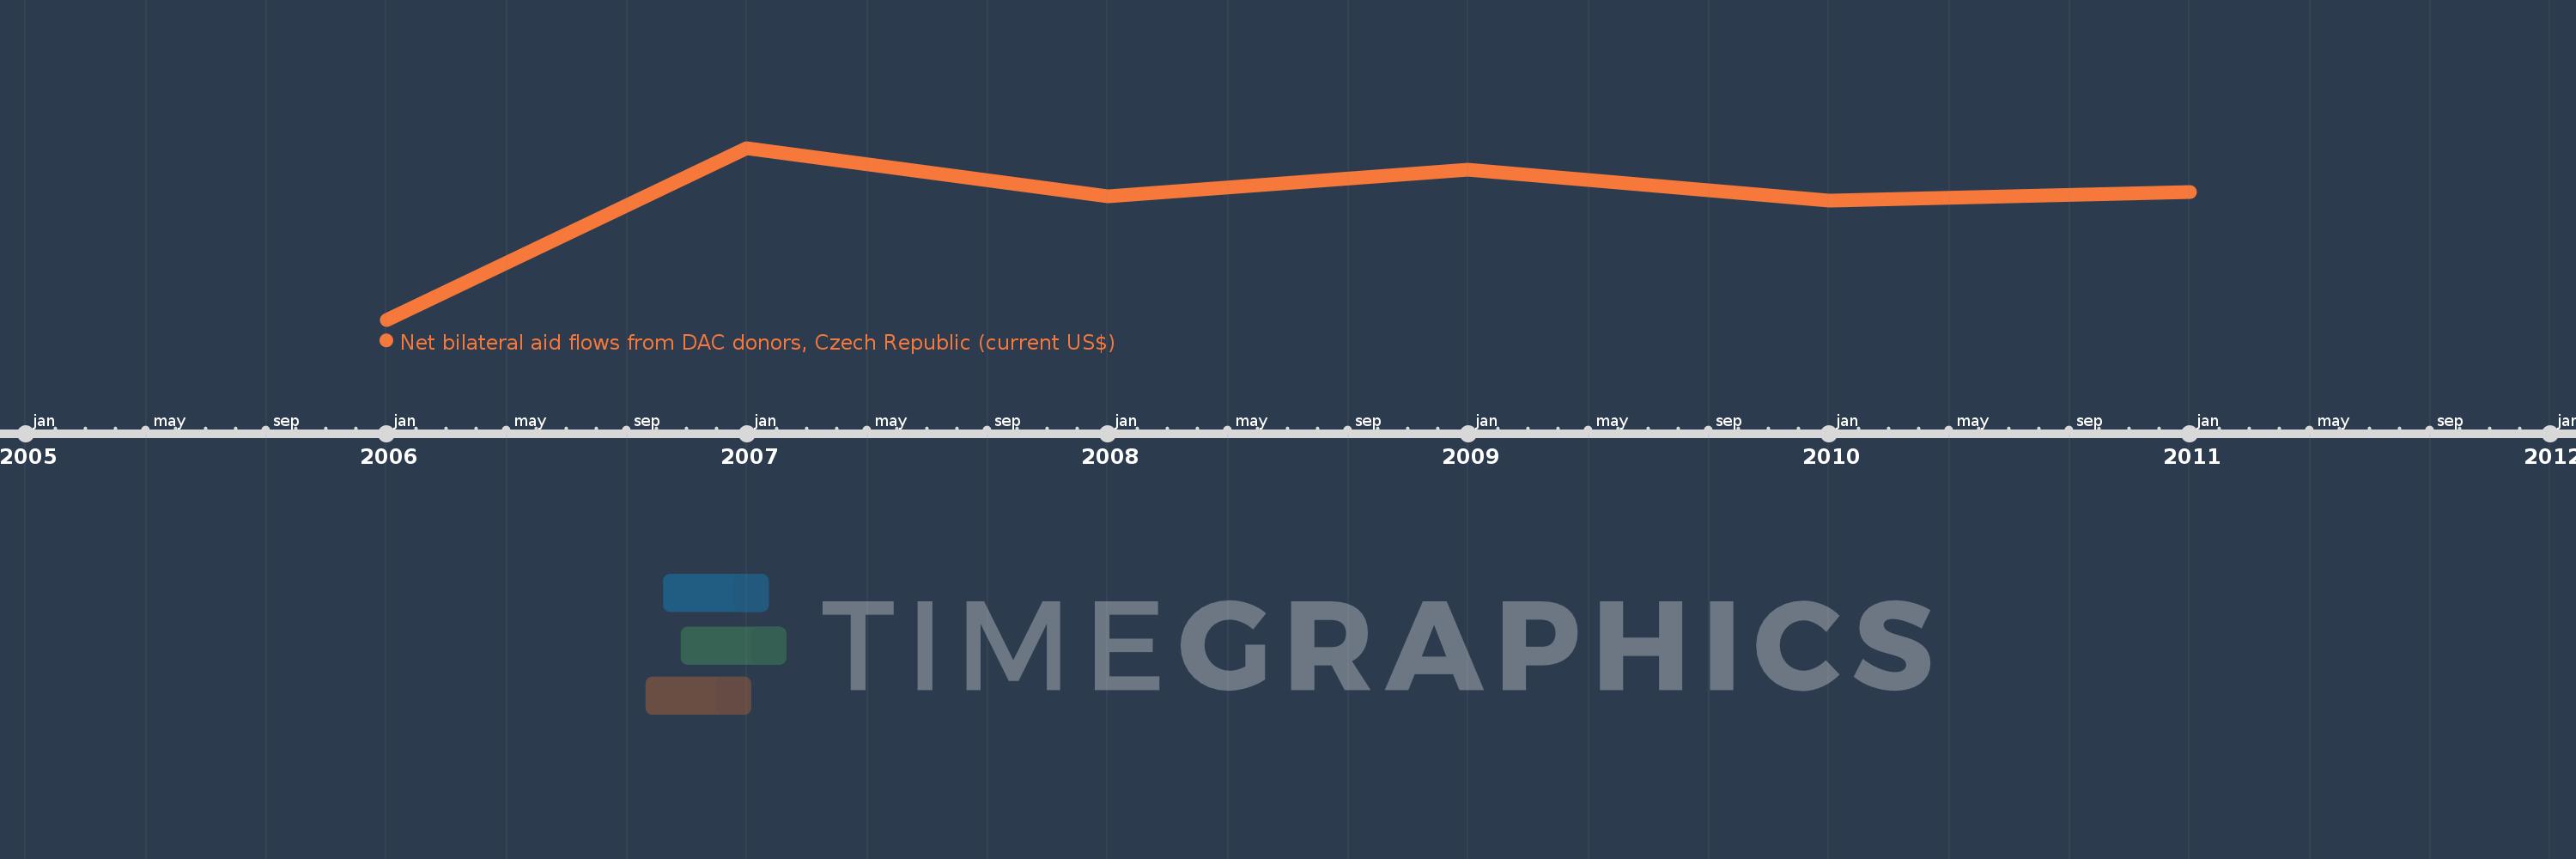
Net bilateral aid flows from DAC donors, Czech Republic (current US$)
2011,2010,2009,2008,2007,2006
This statistics in other country:
Timeline:
This timeline shows a graph from 2006 to 2011 of Croatia. No data until 2005. Number of actual observations by date: 6.
Source name:
World Development Indicators
Source organization:
Development Assistance Committee of the Organisation for Economic Co-operation and Development, Geographical Distribution of Financial Flows to Developing Countries, Development Co-operation
Categories, topics:
Aid Effectiveness
Last updated:
apr 23, 2017
Indicators value changes by year
Minimum:
110.0K
jan 1, 2006
Maximum:
500.0K
jan 1, 2007
At the date of observation
Value
Absolute change
Change from previous value
jan 1, 2006
110.0K
+110.0K
0.0%
jan 1, 2007
500.0K
+390.0K
354.55%
jan 1, 2008
390.0K
-110.0K
-22.0%
jan 1, 2009
450.0K
+60.0K
15.38%
jan 1, 2010
380.0K
-70.0K
-15.56%
jan 1, 2011
400.0K
+20.0K
5.26%
Ranking of countries by current statistics by years


Comments: