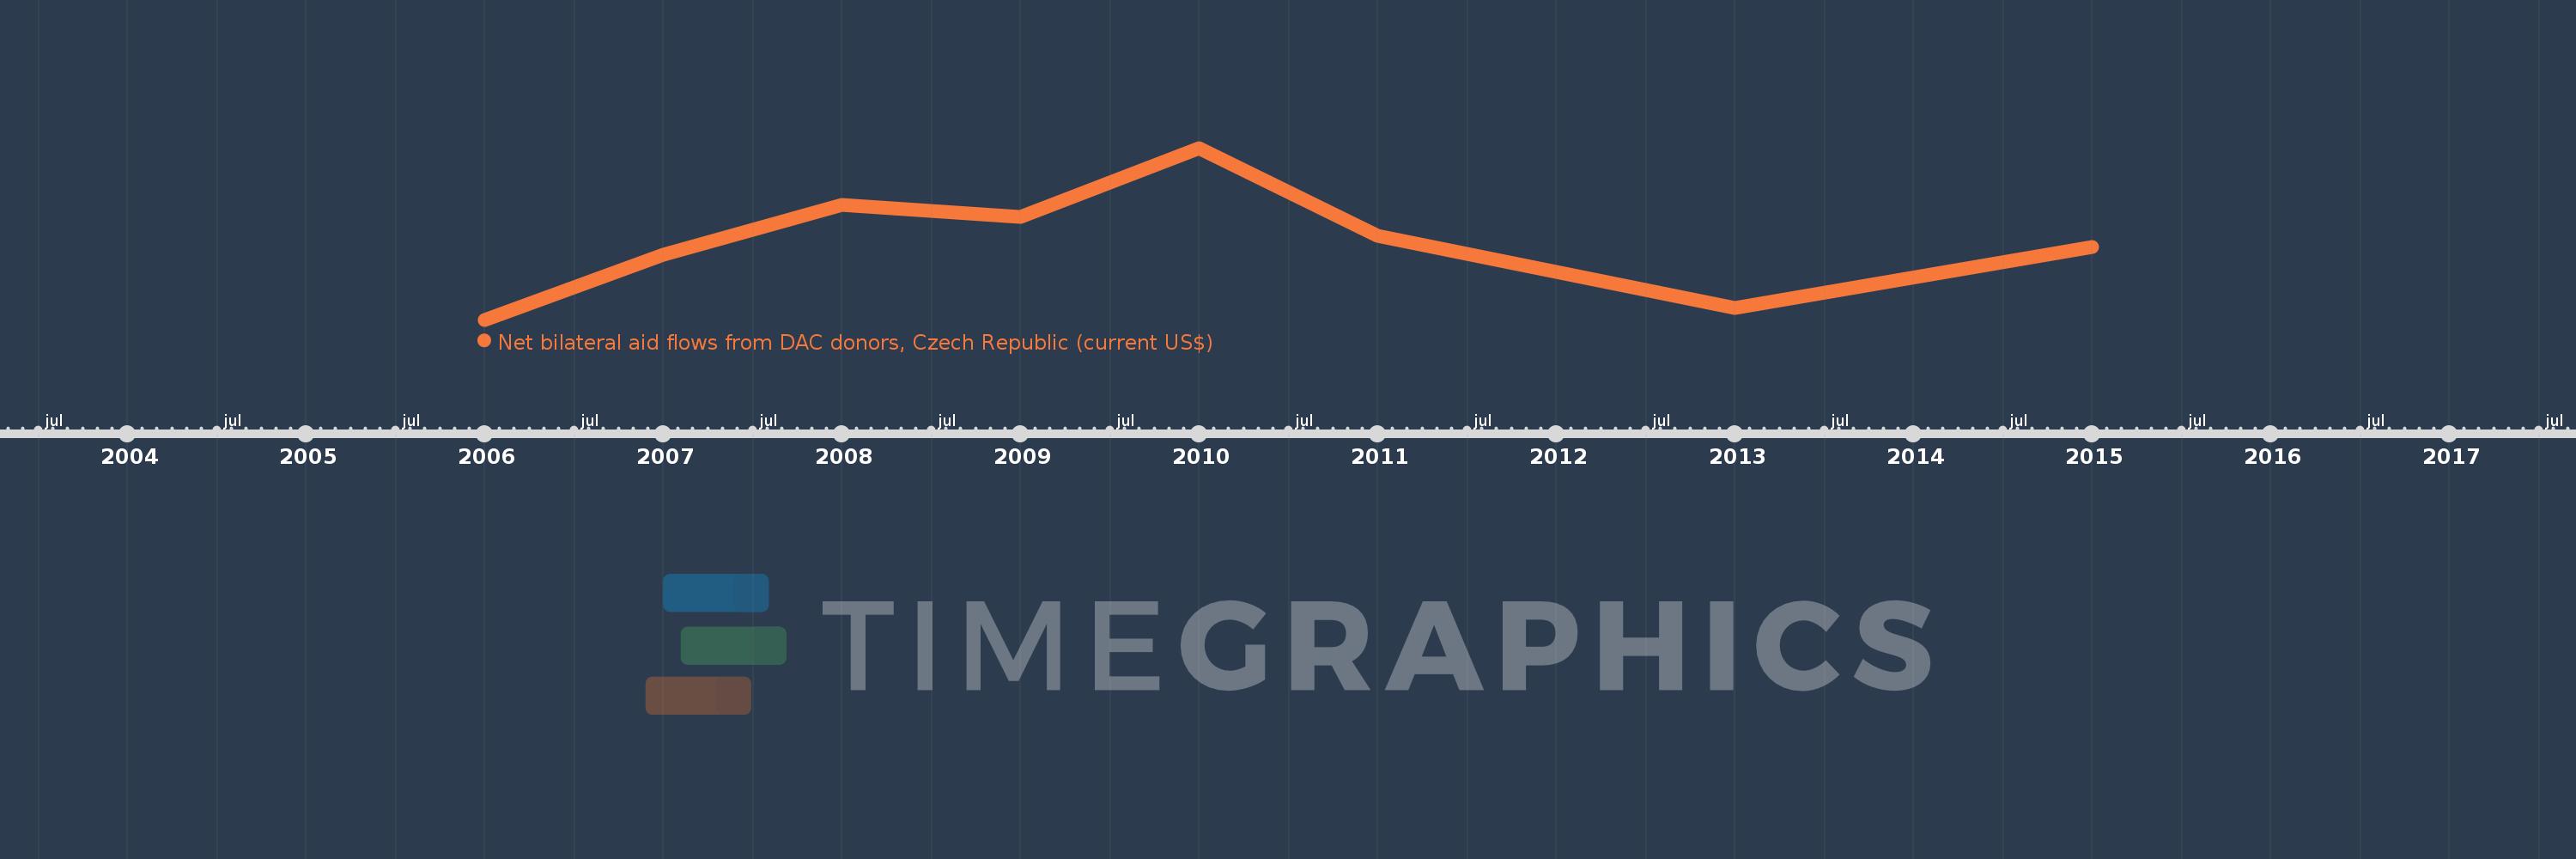
This timeline shows a graph from 2006 to 2015 of Liberia. No data until 2005. Number of actual observations by date: 8.
Source name:
World Development Indicators
Source organization:
Development Assistance Committee of the Organisation for Economic Co-operation and Development, Geographical Distribution of Financial Flows to Developing Countries, Development Co-operation
Categories, topics:
Aid Effectiveness
Last updated:
apr 23, 2017
Indicators value changes by year
Meaning:
313.75K
Minimum:
110.0K
jan 1, 2006
Maximum:
560.0K
jan 1, 2010
At the date of observation
Value
Absolute change
Change from the previous value
jan 1, 2006
110.0K
+110.0K
0.0%
jan 1, 2007
280.0K
+170.0K
154.55%
jan 1, 2008
410.0K
+130.0K
46.43%
jan 1, 2009
380.0K
-30.0K
-7.32%
jan 1, 2010
560.0K
+180.0K
47.37%
jan 1, 2011
330.0K
-230.0K
-41.07%
jan 1, 2013
140.0K
-190.0K
-57.58%
jan 1, 2015
300.0K
+160.0K
114.29%
Ranking of countries by current statistics by years
