29
/
en
AIzaSyAYiBZKx7MnpbEhh9jyipgxe19OcubqV5w
April 1, 2024
273923
Ukraine
UKR
true
2
1
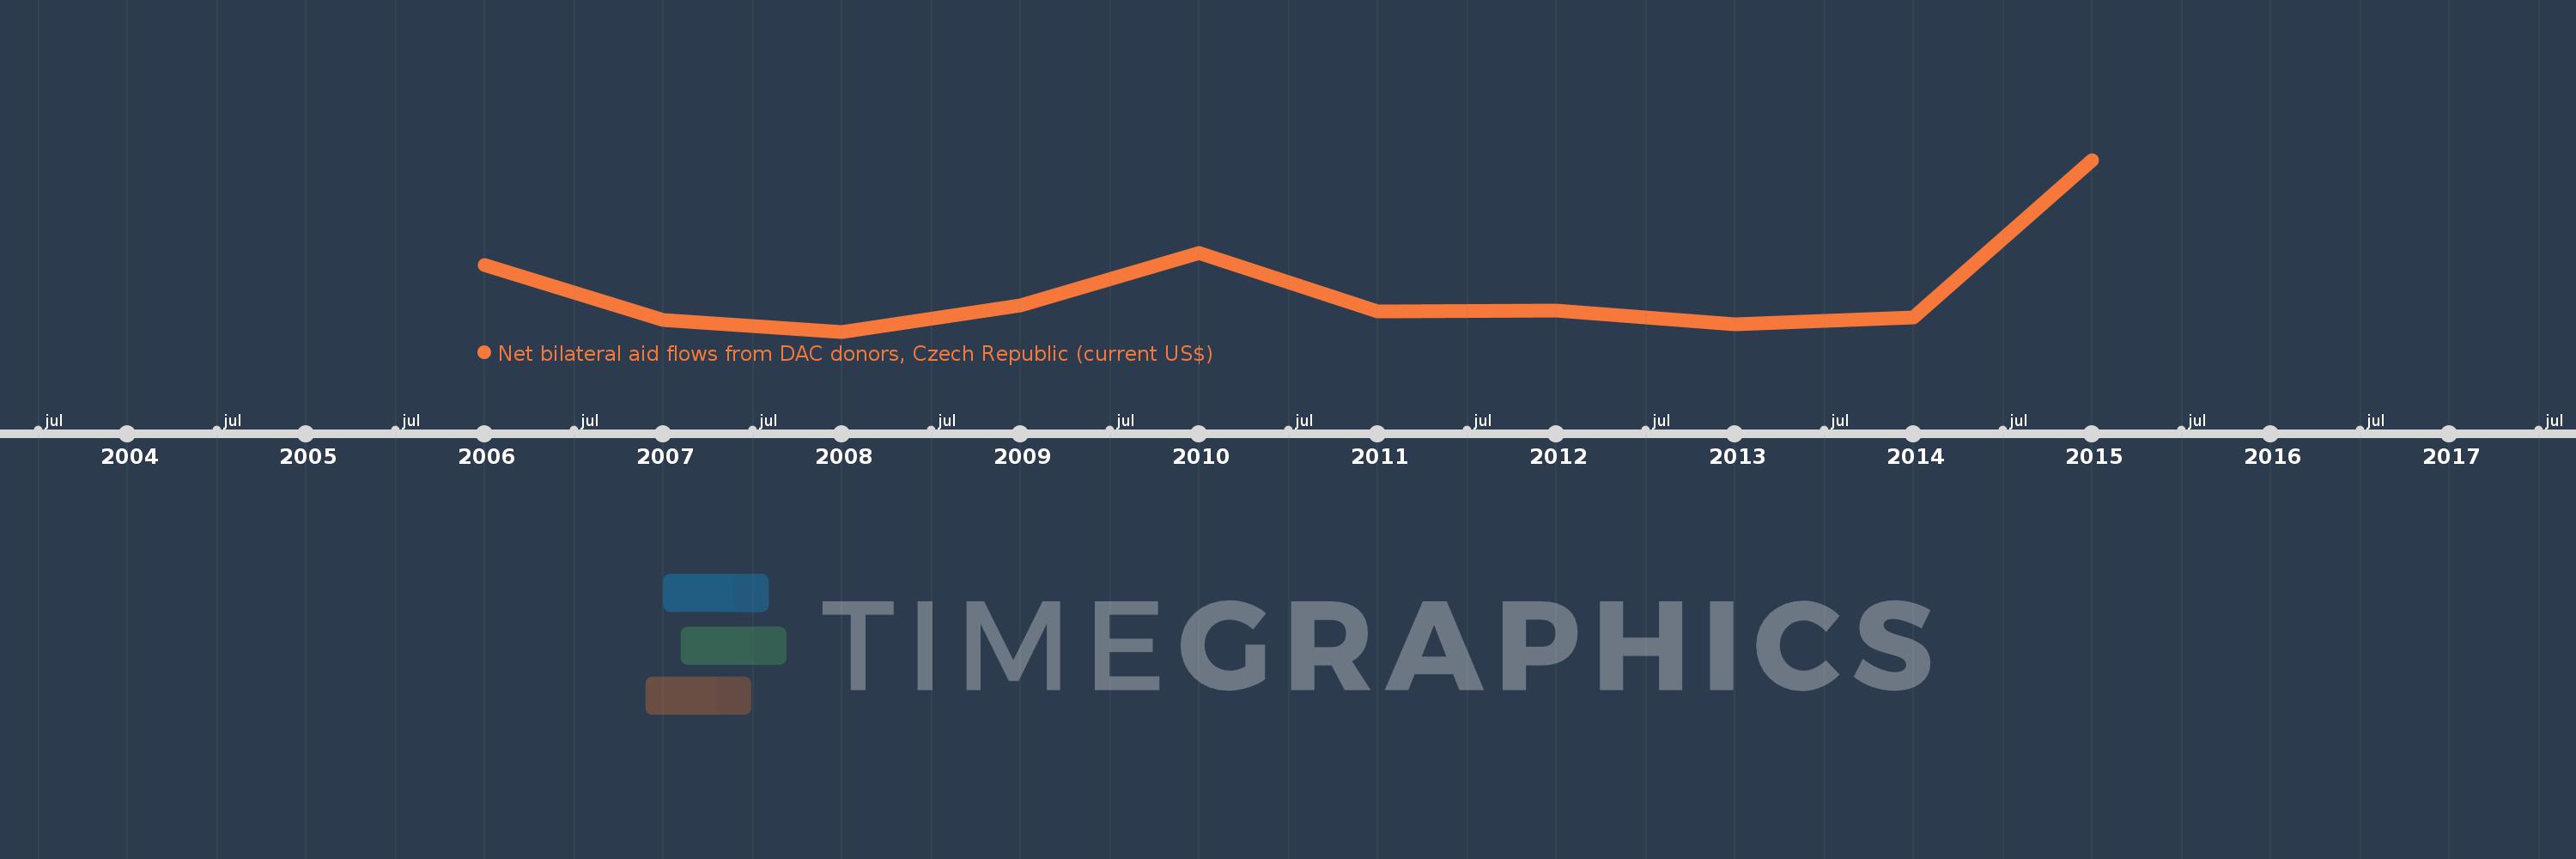
Net bilateral aid flows from DAC donors, Czech Republic (current US$)
2015,2014,2013,2012,2011,2010,2009,2008,2007,2006
This statistics in other country:
Timeline:
This timeline shows a graph from 2006 to 2015 of Ukraine. No data until 2005. Number of actual observations by date: 10.
Source name:
World Development Indicators
Source organization:
Development Assistance Committee of the Organisation for Economic Co-operation and Development, Geographical Distribution of Financial Flows to Developing Countries, Development Co-operation
Categories, topics:
Aid Effectiveness
Last updated:
apr 23, 2017
Indicators value changes by year
Minimum:
2.3 mln
jan 1, 2008
Maximum:
8.26 mln
jan 1, 2015
At the date of observation
Value
Absolute change
Change from previous value
jan 1, 2006
4.62 mln
+4.62 mln
0.0%
jan 1, 2007
2.69 mln
-1.93 mln
-41.77%
jan 1, 2008
2.3 mln
-390.0K
-14.5%
jan 1, 2009
3.2 mln
+900.0K
39.13%
jan 1, 2010
5.03 mln
+1.83 mln
57.19%
jan 1, 2011
3.01 mln
-2.02 mln
-40.16%
jan 1, 2012
3.03 mln
+20.0K
0.66%
jan 1, 2013
2.54 mln
-490.0K
-16.17%
jan 1, 2014
2.78 mln
+240.0K
9.45%
jan 1, 2015
8.26 mln
+5.48 mln
197.12%
Ranking of countries by current statistics by years


Comments: