29
/
en
AIzaSyAYiBZKx7MnpbEhh9jyipgxe19OcubqV5w
April 1, 2024
63786
Afghanistan
AFG
true
2
1
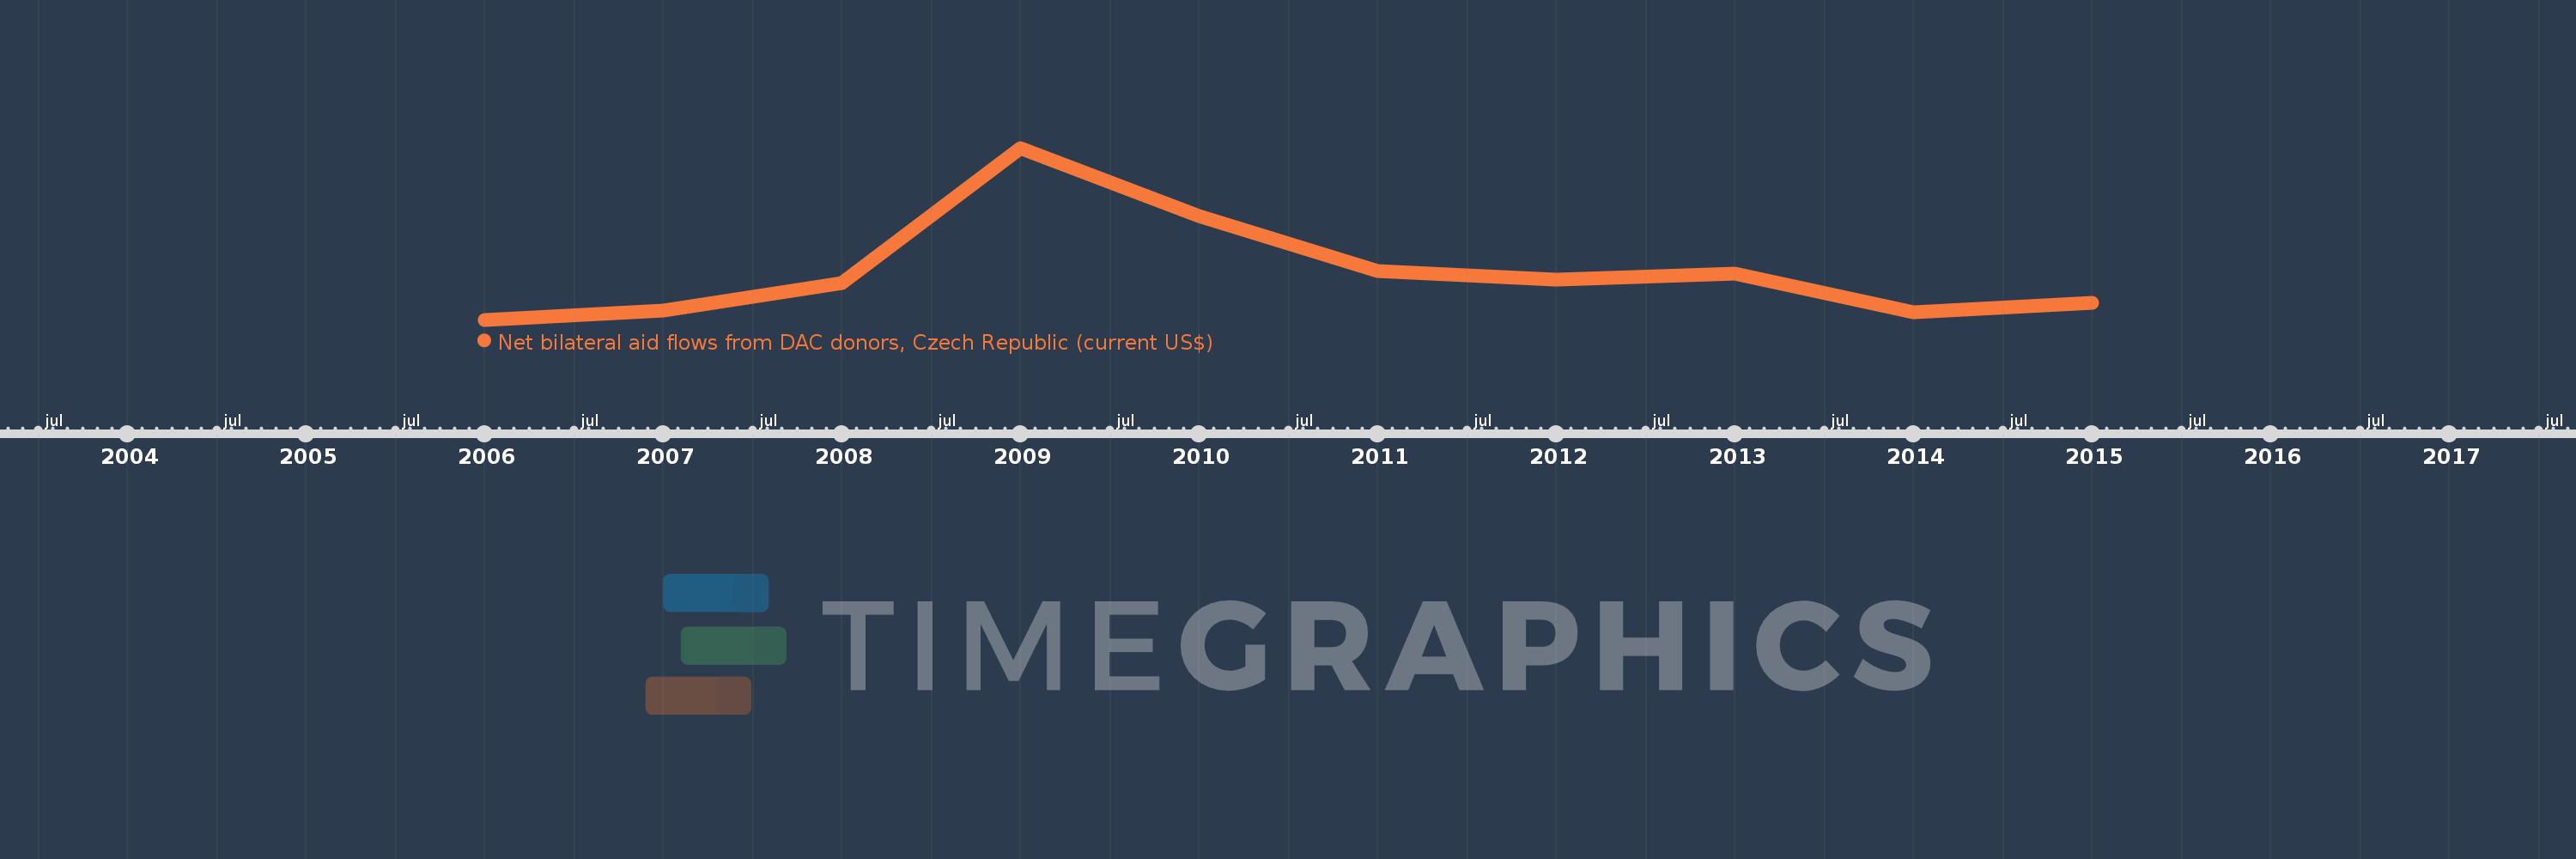
Net bilateral aid flows from DAC donors, Czech Republic (current US$)
2015,2014,2013,2012,2011,2010,2009,2008,2007,2006
This statistics in other country:
Timeline:
This timeline shows a graph from 2006 to 2015 of Afghanistan. No data until 2005. Number of actual observations by date: 10.
Source name:
World Development Indicators
Source organization:
Development Assistance Committee of the Organisation for Economic Co-operation and Development, Geographical Distribution of Financial Flows to Developing Countries, Development Co-operation
Categories, topics:
Aid Effectiveness
Last updated:
apr 23, 2017
Indicators value changes by year
Minimum:
1.96 mln
jan 1, 2006
Maximum:
42.1 mln
jan 1, 2009
At the date of observation
Value
Absolute change
Change from previous value
jan 1, 2006
1.96 mln
+1.96 mln
0.0%
jan 1, 2007
4.2 mln
+2.24 mln
114.29%
jan 1, 2008
10.62 mln
+6.42 mln
152.86%
jan 1, 2009
42.1 mln
+31.48 mln
296.42%
jan 1, 2010
26.09 mln
-16.01 mln
-38.03%
jan 1, 2011
13.26 mln
-12.83 mln
-49.18%
jan 1, 2012
11.36 mln
-1.9 mln
-14.33%
jan 1, 2013
12.7 mln
+1.34 mln
11.8%
jan 1, 2014
3.79 mln
-8.91 mln
-70.16%
jan 1, 2015
5.83 mln
+2.04 mln
53.83%
Ranking of countries by current statistics by years


Comments: