29
/
en
AIzaSyAYiBZKx7MnpbEhh9jyipgxe19OcubqV5w
April 1, 2024
98923
Cambodia
KHM
true
2
1
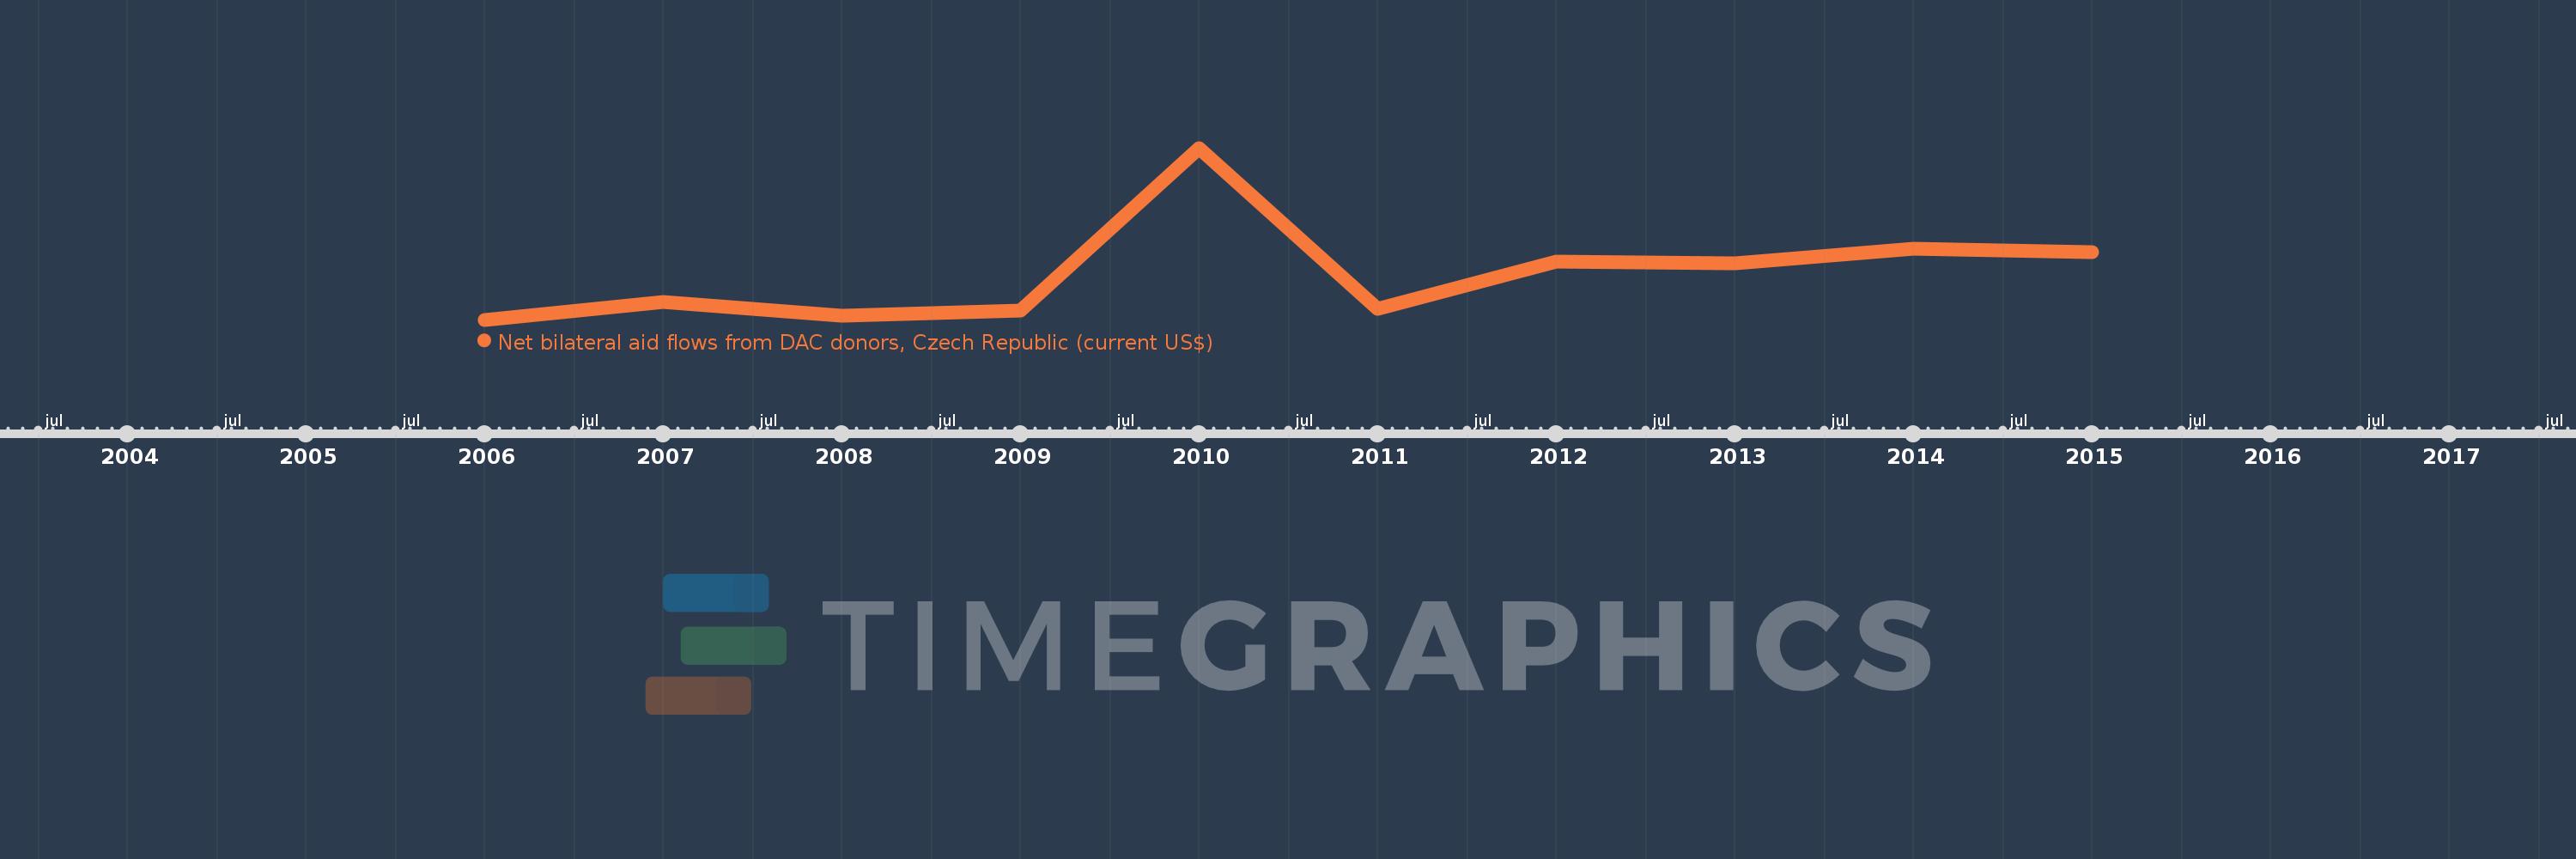
Net bilateral aid flows from DAC donors, Czech Republic (current US$)
2015,2014,2013,2012,2011,2010,2009,2008,2007,2006
This statistics in other country:
Timeline:
This timeline shows a graph from 2006 to 2015 of Cambodia. No data until 2005. Number of actual observations by date: 10.
Source name:
World Development Indicators
Source organization:
Development Assistance Committee of the Organisation for Economic Co-operation and Development, Geographical Distribution of Financial Flows to Developing Countries, Development Co-operation
Categories, topics:
Aid Effectiveness
Last updated:
apr 23, 2017
Indicators value changes by year
Maximum:
2.76 mln
jan 1, 2010
At the date of observation
Value
Absolute change
Change from previous value
jan 1, 2006
30.0K
+30.0K
0.0%
jan 1, 2007
310.0K
+280.0K
933.33%
jan 1, 2008
100.0K
-210.0K
-67.74%
jan 1, 2009
180.0K
+80.0K
80.0%
jan 1, 2010
2.76 mln
+2.58 mln
1.43K%
jan 1, 2011
200.0K
-2.56 mln
-92.75%
jan 1, 2012
960.0K
+760.0K
380.0%
jan 1, 2013
930.0K
-30.0K
-3.13%
jan 1, 2014
1.16 mln
+230.0K
24.73%
jan 1, 2015
1.11 mln
-50.0K
-4.31%
Ranking of countries by current statistics by years


Comments: