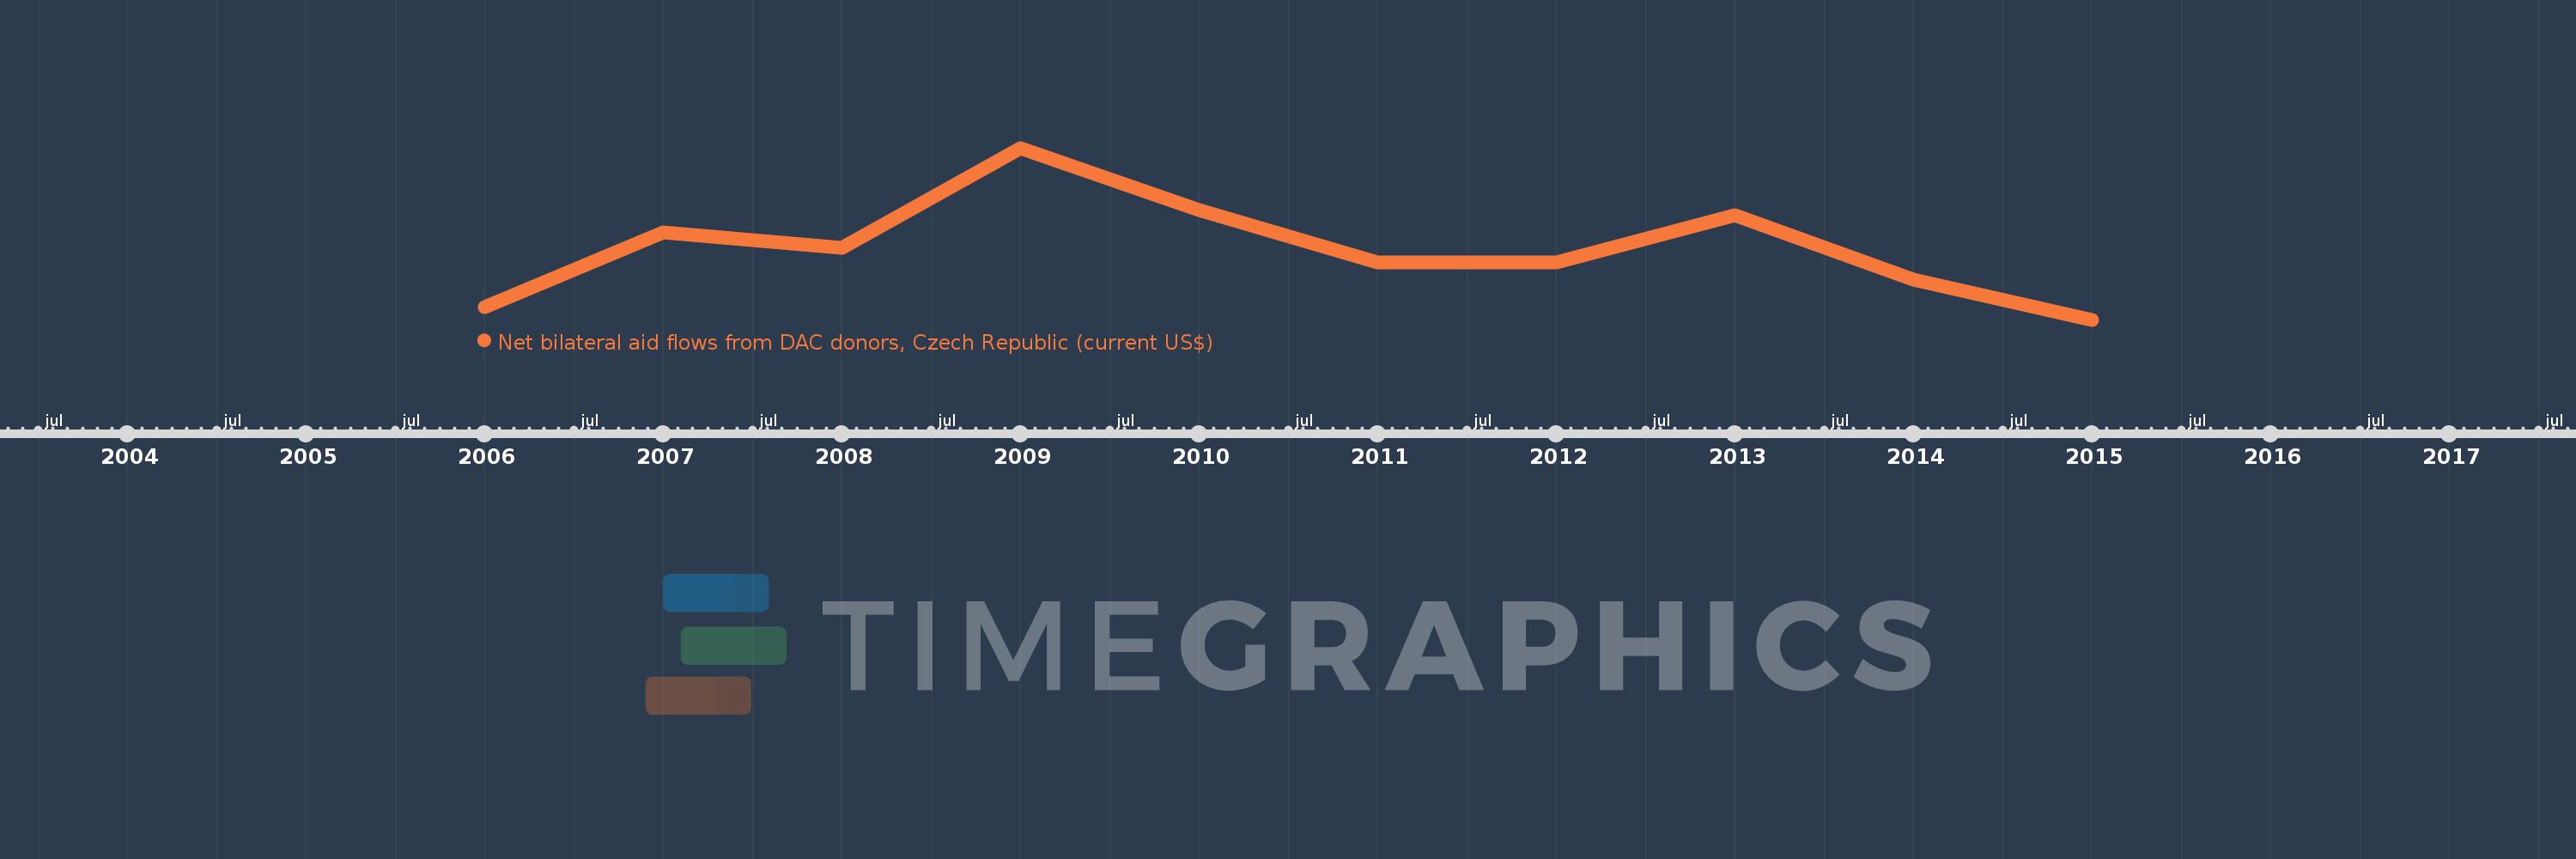
This timeline shows a graph from 2006 to 2015 of Mali. No data until 2005. Number of actual observations by date: 10.
Source name:
World Development Indicators
Source organization:
Development Assistance Committee of the Organisation for Economic Co-operation and Development, Geographical Distribution of Financial Flows to Developing Countries, Development Co-operation
Categories, topics:
Aid Effectiveness
Last updated:
apr 23, 2017
Indicators value changes by year
Meaning:
296.0K
Minimum:
10.0K
jan 1, 2015
Maximum:
700.0K
jan 1, 2009
At the date of observation
Value
Absolute change
Change from the previous value
jan 1, 2006
60.0K
+60.0K
0.0%
jan 1, 2007
360.0K
+300.0K
500.0%
jan 1, 2008
300.0K
-60.0K
-16.67%
jan 1, 2009
700.0K
+400.0K
133.33%
jan 1, 2010
450.0K
-250.0K
-35.71%
jan 1, 2011
240.0K
-210.0K
-46.67%
jan 1, 2012
240.0K
0.0
0.0%
jan 1, 2013
430.0K
+190.0K
79.17%
jan 1, 2014
170.0K
-260.0K
-60.47%
jan 1, 2015
10.0K
-160.0K
-94.12%
Ranking of countries by current statistics by years
